Semi-Solid State Battery Testing for EV Packs: Formation Windows, Stack-Pressure Cycling Rigs, and Fast-Charge Qualification
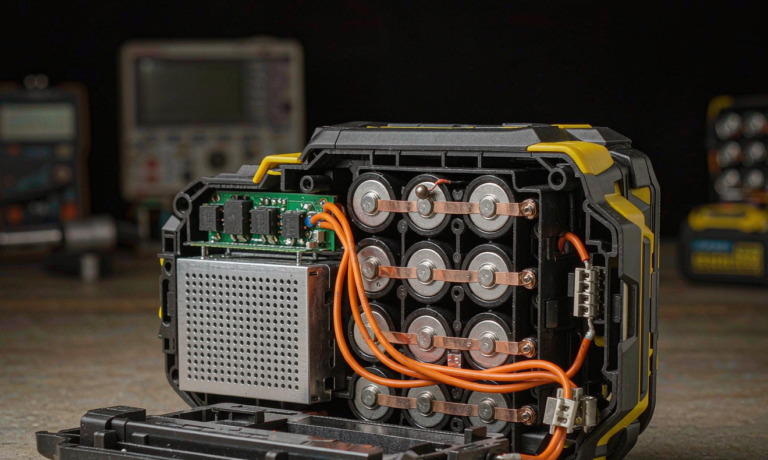
In my twelve years running pack validation lines, no technology has forced me to rewrite my test plans as aggressively as semi-solid-state chemistry. When the first EV development packs arrived at our lab, I ran them through our conventional lithium-ion playbook and got numbers that made no sense: formation gas evolution three times lower than expected, yet interface impedance that drifted 15% in the first 200 cycles. The chemistry was fine. My fixtures, my formation windows, and my fast-charge acceptance criteria were all wrong for this cell class. Testing a semi-solid state battery pack for an EV program is not a copy-paste exercise — the gel-polymer electrolyte, the retained liquid fraction, and the pressure-sensitive interfaces change nearly every gate in the qualification plan.
This article is the validation protocol I now use for EV packs built on semi-solid-state cells — covering formation windows, stack-pressure cycling rigs, fast-charge qualification, abuse response, and the pack-level gates I insist on before any fleet vehicle sees these packs. Whether you are evaluating a supplier or setting up an in-house EV pack line, the sequence below will save you the six months of false starts I paid for.
What Makes Semi-Solid-State EV Packs a Different Test Problem
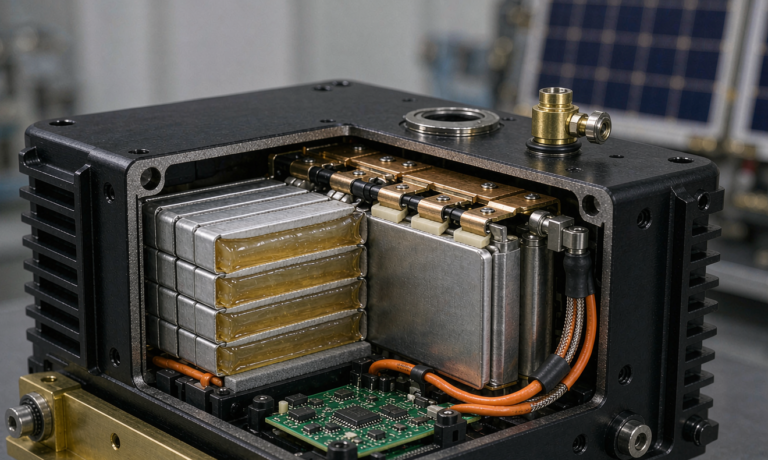
A semi-solid-state cell sits between conventional lithium-ion and true all-solid-state designs. Typically 5–10% liquid electrolyte remains by weight, distributed through a gel-polymer matrix, often with in-situ polymerized or ceramic-filled separators. That hybrid construction changes test behavior in three ways that matter at pack level.
First, the interface between the gel electrolyte and the electrode is pressure-dependent. Contact impedance falls measurably as stack pressure rises from free-standing to roughly 0.5 MPa, then flattens. A pack that restrains cells at the wrong pressure will show capacity fade that has nothing to do with the chemistry — I have seen 8–12% worse retention at 600 cycles in loose fixtures versus correctly torqued ones.
Second, gas evolution during formation is lower but slower to reabsorb. Conventional NMC packs vent and settle within a few formation cycles; semi-solid cells can carry residual interface gas for 50+ cycles, which shows up as rising DCIR scatter in early life. If your end-of-line criteria assume conventional settling behavior, you will falsely reject good packs.
Third, the thermal behavior differs. Reduced flammable liquid content typically pushes thermal runaway onset higher — our ARC testing on one 360 Wh/kg class cell showed onset near 210°C versus 150–165°C for a comparable conventional NMC811 cell — but the semi-solid gel can smolder and re-ignite unpredictably during propagation events. Abuse testing needs its own protocol, not a scaled-down lithium-ion one.
Formation Windows: The First 72 Hours Decide the Next 1,500 Cycles
Most suppliers deliver EV cells pre-formed, which tempts pack builders to skip formation validation entirely. That is a mistake. What you inherit is the supplier’s formation recipe; what you need to know is how sensitive the cell is to deviation from it, because your pack-level processes — welding, potting, thermal curing of adhesives — all add thermal and mechanical history on top of the cell’s formation.
My formation window validation runs three sub-lots of 20 cells each through deliberately shifted recipes: a baseline, a high-temperature variant (+8°C on every formation step), and a shortened variant (hold times cut 40%). I then compare first-cycle coulombic efficiency, gas volume by in-situ swelling measurement, and DCIR at 25°C.
For the semi-solid cells we qualified last year, first-cycle CE came in at 91.4% baseline, dropping to 90.1% on the shortened recipe, with swelling of 1.8% versus 2.6% — the cells breathe differently, and the scatter band across recipes tells you how much process window your pack line actually has. If the high-temperature variant pushes interface impedance up more than 5%, your adhesive curing ovens and potting exotherm need explicit review, because that is exactly the exposure they create.
One more formation-stage trap: voltage holds. Semi-solid chemistries benefit from a controlled hold at top-of-charge during formation — our supplier specified 3.85 V for 4 hours — because it completes gel-electrolyte wetting and stabilizes the CEI layer. When we skipped the hold in the shortened variant, early-cycle DCIR scatter doubled from ±3 mΩ to ±6 mΩ on 2 Ah pouch cells. That scatter propagates straight into pack balancing time at end of line.
Stack-Pressure Cycling Rigs: Fix Your Fixtures Before You Trust Your Data
Every cycling result for a semi-solid state battery is conditional on the pressure the cells experienced. This is the single biggest source of irreproducible data in the industry right now, and it is almost entirely a fixture problem.
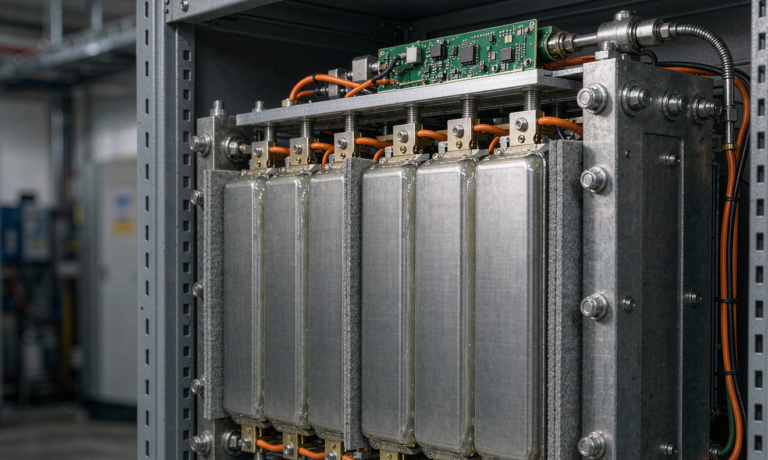
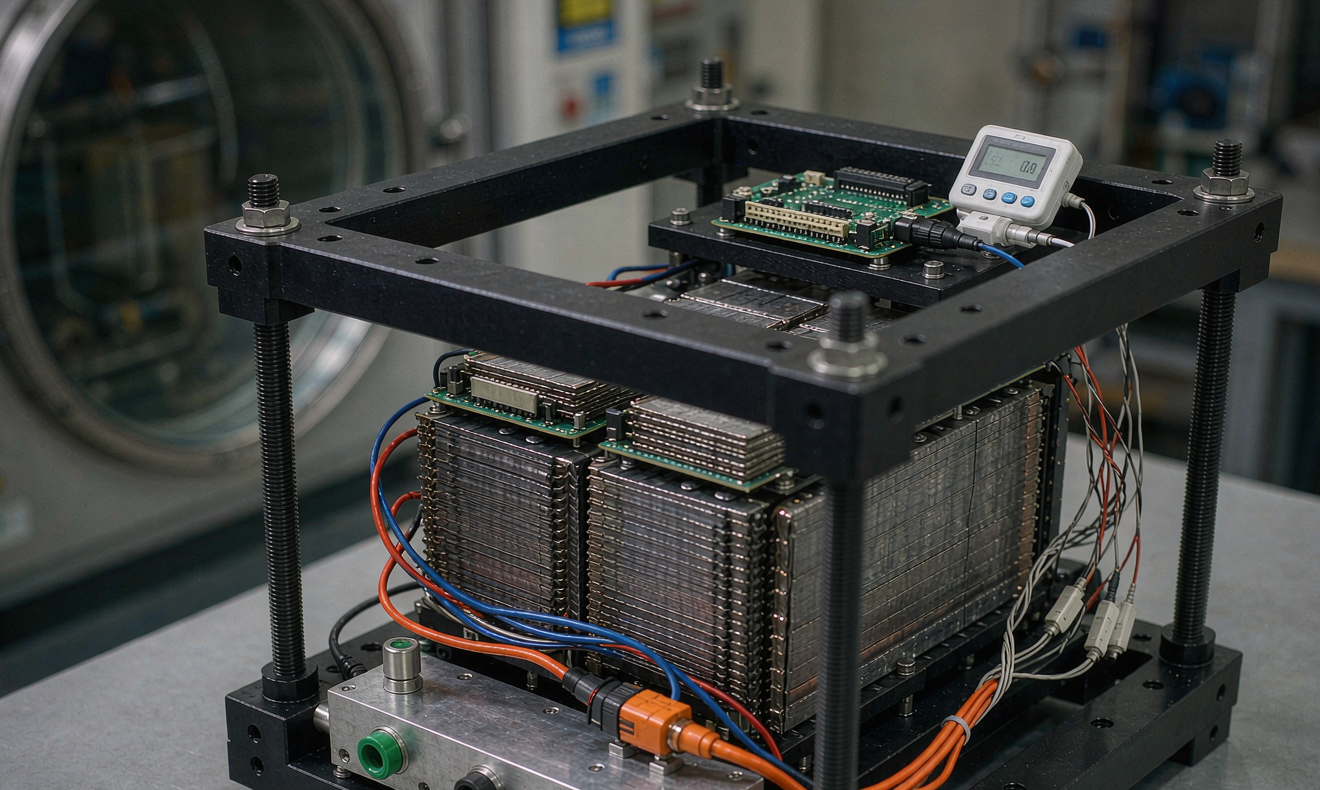
I specify rigid fixtures with instrumented preload: four M10 tie rods, disk springs to maintain load as the stack breathes, and a thin-film pressure sensor at the stack center. Target pressure for most current gel-polymer EV cells is 0.2–0.5 MPa; I verify actual stack pressure at 100% and 0% state of charge, because stack thickness change across the SOC range can swing real pressure by 15–20% in an undersized fixture.
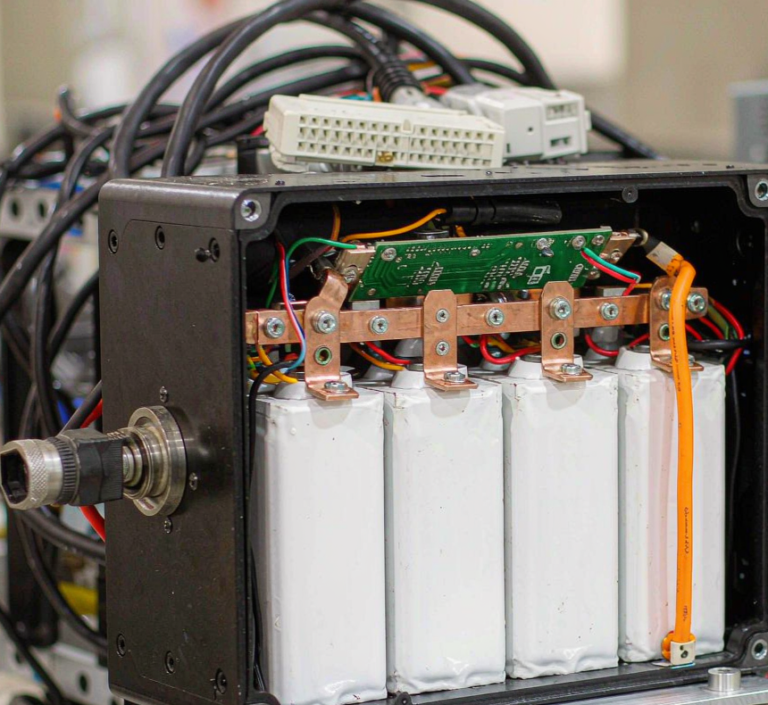
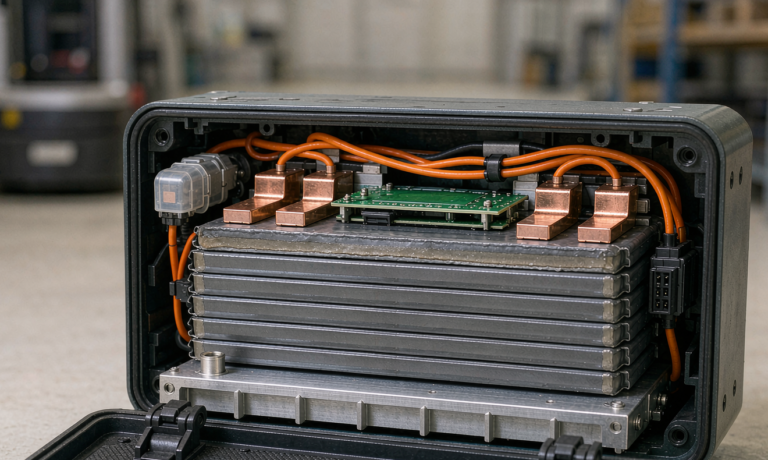
For pack-level cycling, the module end plates become the fixture. That means your module design itself is part of the test setup — a compliance-heavy end plate that relaxes 0.15 MPa over 500 cycles is a durability defect, and it will show up in your cycling data as accelerating fade that you will otherwise blame on the cells. We caught exactly this on a 140 kWh EV pack development: cell-level cycling in rigid fixtures showed 92% retention at 800 cycles, but the first module-level rig showed 87% — the end-plate fastener relaxation was the difference. A Belleville washer stack on the tie rods brought module results back within 1.5% of cell-level predictions.
Instrument every long-duration rig with periodic DCIR checks — I run a 10-second 1C pulse every 50 cycles — and log fixture pressure alongside capacity. Correlating the two curves is how you separate chemistry fade from mechanical relaxation, and it is the evidence base you will need when your OEM customer asks why your pack warranty model looks pessimistic.
Fast-Charge Qualification: Watching for Plating Where the Electrolyte Is Thickest
Fast-charge capability is where semi-solid cells promise the most and test the trickiest. The gel matrix changes ion transport: ionic conductivity through the gel layer near the anode can be lower than in free liquid, so local polarization at high C-rates is the plating risk zone.
My fast-charge protocol runs a staircase charge — 1C to 20% SOC, 2C to 50%, tapering to 1.5C and then 1C to 80% — repeated at 25°C, with full teardown-level diagnostics every 100 cycles. The key detection tool is differential voltage analysis (dV/dQ). Lithium plating shows up first as a growing low-voltage shoulder in the dV/dQ curve long before capacity fade becomes obvious. On our 2C program, plating onset appeared in dV/dQ at cycle 340 while capacity retention was still 96% — a pure capacity-screen program would have passed those cells straight into a fleet.
I back the electrical analysis with two confirmations. Incremental capacity peaks shift when lithium inventories change, and a post-test cell teardown with SEM cross-sectioning at the anode edge validates what the electrochemical signatures suggest. On one 4C trial, the dV/dQ shoulder appeared within 120 cycles; teardown confirmed edge plating concentrated where the gel layer was thickest due to a fill-gradient defect — a supplier process issue, not a chemistry limit.
Temperature derating gets tested, not assumed. The same staircase at 0°C typically forces a 40–50% current reduction to stay below plating thresholds, and at -10°C we do not fast-charge at all — the pack BMS enforces this, and the validation job is to prove the BMS limits match the cell data, with margin. I require the BMS current-versus-temperature map to sit at least 15% below the cell test plating onset boundary at every temperature point.
Standards frame matters here: cell-level fast-charge cycling feeds the durability requirements of IEC 62660-1 and the USABC goals your automotive customer will cite, while the pack-level charge behavior plugs into ISO 12405-4 test sequences. None of these standards yet have semi-solid-specific annexes, so document your pressure fixtures, your dV/dQ thresholds, and your teardown evidence — an OEM auditor will ask.
Abuse and Safety Validation: UN 38.3 Is the Floor, Not the Plan
Transport qualification under UN 38.3, and cell safety screening under IEC 62133-2, are non-negotiable floors for any EV lithium battery. But the abuse plan for a semi-solid-state EV pack has to go further, and it has to respect how the gel phase burns.
Thermal propagation is the headline item. Under GB 38031-2020 requirements — which most global OEMs now reference even outside China — a single-cell trigger must not cause dangerous propagation without a five-minute occupant warning window. Semi-solid construction genuinely helps here: in our trigger tests with a 50 Ah class cell, peak neighboring-cell temperatures ran 40–60°C lower than an equivalent conventional pack, and the five-minute warning was comfortably met with standard voltage-drop sensing. But the gel phase changes fire behavior — halon-style clean agents are less effective against smoldering gel, and we observed re-ignition 11 minutes after initial suppression in one burn-chamber test. Your firefighting access design and post-event monitoring recommendations need to reflect that.
Nail penetration and crush tests run at cell and module level per SAE J2464 and the EUCAR hazard level framework. I log not just pass/fail but the hazard level achieved — semi-solid cells we tested reached EUCAR 4 on nail (no fire, venting only) versus EUCAR 6 for the conventional equivalent, which is a genuine, documentable safety argument for your OEM conversations.
Overcharge tolerance also differs. The semi-solid cells tolerated 110% SOC overcharge with venting but no thermal runaway, where the conventional baseline went into runaway at the same condition. I would not design a protection strategy around that margin — the BMS hardware cutoff at 105% stays — but knowing the real ceiling changes your failure-mode analysis from catastrophic to recoverable in several scenarios.
Pack-Level Gates: The Sequence I Run Before Fleet Release
Cell data never survives contact with the pack unchanged, so my final release sequence runs five gates on complete packs before any vehicle integration.
- Gate 1 — End-of-line formation confirmation. Every pack gets a 0.5C characterization cycle plus DCIR pulse; acceptance bands come from the formation-window study, set at ±2 standard deviations of the baseline lot, not supplier datasheet limits.
- Gate 2 — Vibration and mechanical shock. Random vibration per ISO 12405-4 / UN 38.3 profile, with fixture pressure re-verified after test. Fastener relaxation beyond 10% of preload fails the pack even if electricals pass.
- Gate 3 — Thermal cycling with in-situ impedance. -30°C to +55°C excursions with periodic hybrid pulse power characterization per IEC 62660-1; I track DCIR growth across the cycle count as an early interface-degradation signal.
- Gate 4 — Fast-charge durability. 300 staircase fast-charge cycles at 25°C with dV/dQ screening at every 50 cycles; any plating signature retires the pack and opens a root-cause loop.
- Gate 5 — System-level dry runs. Full BMS fault-injection matrix — contactor weld detection, current-sensor plausibility, isolation resistance at 500 V — because a semi-solid pack’s higher thermal runaway onset is worth nothing if a stuck contactor goes undetected.
Packs that clear all five gates go into a 90-day fleet-shadow phase on test vehicles before release. Across our last three programs, gates 2 and 4 caught every field-relevant defect; nothing that reached fleet shadow ever failed for a reason the gates had not already screened. That is the outcome a good validation plan buys you: surprises on the bench, not on the road.
Working With Suppliers on Semi-Solid-State Programs
If you are an OEM or fleet operator rather than a cell maker, most of what determines your test success was decided at the supplier — in their formation recipe, their fill process, and their pressure recommendations. Ask three questions before signing any semi-solid state battery supply agreement.
One: what is the validated stack-pressure window, and what happens outside it? A supplier who cannot give you a pressure-versus-cycle-life curve is shipping cells they have not finished characterizing. Two: what is the formation recipe sensitivity — how much does first-cycle CE and DCIR scatter move across realistic process deviations? That number sizes your end-of-line acceptance bands. Three: will they share dV/dQ reference fingerprints from their own fast-charge aging, so your screening thresholds are anchored to their data rather than generic literature?
For buyers who need pack integration matched to a specific vehicle platform, a custom battery solution partner that runs its own pressure-instrumented cycling rigs and dV/dQ screening can compress qualification timelines substantially, because the semi-solid-specific test infrastructure already exists — building it from zero is a six-month detour I have watched more than one program take.
Frequently Asked Questions
How is testing a semi-solid-state EV pack different from a conventional lithium-ion pack?
Three practical differences: results are stack-pressure dependent, so fixtures must be rigid and instrumented; early-life gas behavior and DCIR scatter differ, so end-of-line acceptance bands must be re-derived from formation studies rather than reused; and abuse response shifts — higher thermal runaway onset, but different fire and re-ignition behavior that changes propagation and firefighting assumptions.
What stack pressure should I use for cycling semi-solid-state cells?
Most current gel-polymer EV cells are validated in the 0.2–0.5 MPa range, but the correct answer comes from your supplier’s pressure-sweep data, not from a rule of thumb. Verify actual pressure at both SOC extremes and log it continuously — a fixture that relaxes during the test will corrupt your fade data.
Can I skip formation testing if cells arrive pre-formed from the supplier?
No. You are not re-forming the cells; you are measuring how sensitive they are to process deviation, because pack assembly (welding heat, potting exotherm, adhesive curing) adds history on top of supplier formation. A three-recipe sensitivity study of 60 cells is cheap insurance for your end-of-line criteria.
How do you detect lithium plating during fast-charge testing?
Differential voltage analysis (dV/dQ) is the primary screen — plating appears as a growing low-voltage shoulder well before capacity fade. Confirm with incremental capacity analysis and periodic teardown with SEM cross-sectioning. On our programs, dV/dQ flagged plating at cycle 340 while capacity retention was still 96%, which pure capacity screening would have missed.
Which standards apply to semi-solid-state EV pack qualification?
UN 38.3 for transport, IEC 62133-2 and IEC 62660 for cell safety and performance, GB 38031-2020 for thermal propagation, SAE J2464 and EUCAR hazard levels for abuse, and ISO 12405-4 for pack-level test sequences. There is no semi-solid-specific annex yet, so document your fixtures and thresholds carefully for OEM audits.
Are semi-solid-state EV packs safer than conventional lithium-ion packs?
Generally yes on thermal runaway onset — our ARC data showed onset near 210°C versus 150–165°C for comparable NMC cells, and nail tests reached EUCAR 4 instead of 6. But the gel phase smolders and can re-ignite after suppression, so safety-case documentation must address post-event monitoring, not just propagation limits.