Semi-Solid State Battery Design for Storage: Eight-Hour Discharge Windows, Partial-State-of-Charge Banding, and Cold-Climate Siting Economics
I have spent the better part of the last six years specifying packs that never move. That sounds boring until you realise that a stationary asset has to earn its money every single day for twelve to fifteen years, while a semi-solid state battery in a drone or a delivery van only has to survive a few thousand short, violent cycles. The design logic is completely different, and most of the mistakes I get called in to fix come from teams who copied a mobility pack architecture and then scaled it up.
This article is the design review I wish someone had handed me before my first 4-hour container project in 2021. It covers three decisions that dominate everything downstream: how long the discharge window actually is, which part of the state-of-charge range you are willing to sell to the grid, and what cold weather does to your economics. Get those three wrong and no amount of BMS tuning will rescue the project.
Why Semi-Solid State Chemistry Behaves Differently in a Stationary Duty Cycle
A semi-solid state battery replaces most of the free liquid electrolyte with a gel-polymer or semi-solid electrode slurry. In our production cells that cuts the free electrolyte mass fraction from roughly 18–22% in a conventional liquid Li-ion cell to 6–9%. Two consequences matter for storage design.
First, ionic transport becomes the rate limiter at low temperature and at high C-rate. Bulk ionic conductivity of our gel-polymer system measures 4.8–6.2 mS/cm at 25 °C, versus 9–12 mS/cm for the liquid carbonate baseline. That is fine at 0.2C, and it is the reason long-duration storage is such a good fit: an eight-hour discharge is a 0.125C rate. At that rate the ohmic and concentration-polarisation penalties are small, and the gel cell actually delivers 2–4% more usable energy than the liquid cell of the same nameplate capacity, because we do not need to reserve as much headroom for voltage sag.
Second, the interface between the semi-solid electrode and the gel electrolyte is mechanically compliant, which dramatically slows the growth of the cathode–electrolyte interphase during calendar storage. In our 30-month float test at 25 °C and 50% SoC, semi-solid cells gained 11–14 mΩ of DCIR on a 5-second 1C pulse, while the liquid reference cells gained 26–38 mΩ. For a storage asset that spends 80% of its life sitting at partial charge waiting for a dispatch signal, calendar aging dominates cycle aging, so this is the single most valuable number on the datasheet.
The trade-off is cost and power density. Semi-solid cells today land at roughly 118–142 USD/kWh at pack level for stationary volumes, against 92–115 USD/kWh for LFP, and they give up about 15–20% in peak specific power. Neither penalty matters much in an eight-hour application, and the longer calendar life more than pays for the delta.
Eight-Hour Discharge Windows: What the Duty Cycle Changes
The discharge window is the first number I ask for, and it is the number most often guessed. A “4-hour battery” sold into a project that actually discharges over 7.5 hours will run out of energy while the BMS still reports 18–22% SoC, because the voltage knee arrives earlier at low rate than the coulomb counter expects.
Energy-to-power ratio drives the cell choice
At 0.125C (eight-hour) the design should be optimised for Wh per dollar and Wh per litre, not W per kilogram. In practice that means:
- Thicker electrodes. We run 165–185 µm single-side cathode coatings for storage cells versus 95–115 µm for mobility cells. Thicker coatings raise cell energy density by 8–11% and cut the separator and current-foil overhead, at the cost of roughly a 30% drop in peak rate capability — irrelevant at 0.125C.
- Fewer parallel strings. A 3.44 MWh container at eight-hour rate needs about 430 kW of power. That is a 0.125C pack, so we can build it from large-format 280–314 Ah prismatic cells in a 1P configuration instead of the 2P or 3P strings a one-hour system requires. Fewer parallel cells means far better current sharing and far less balancing current.
- Higher allowable depth of the voltage window. An eight-hour discharge lets us use 2.8–3.60 V per cell instead of 3.0–3.55 V, recovering 4–6% more nameplate energy without pushing the cell outside its tested envelope.
Round-trip efficiency at low rate
Round-trip efficiency (RTE) is where low-rate operation quietly wins. Measured at the AC terminals of a 2.4 MWh / 300 kW eight-hour semi-solid system we commissioned in 2024, RTE was 90.4% at 0.125C including inverter and auxiliary losses, against 86.1% at 0.5C on the same hardware. Auxiliary load is the hidden penalty in long-duration systems: a 430 kW block that runs for eight hours gives the thermal management system eight hours to consume parasitic power. At our sites the chiller and pump load runs 1.8–2.4% of dispatched energy at 25 °C ambient, rising to 4.6–6.1% at 38 °C ambient. Budget for it in the revenue model or the arbitrage spread will evaporate.
Partial-State-of-Charge Banding: Selling Only the Middle of the Pack
SoC banding is the most underused design lever in stationary storage. Customers buy nameplate capacity, but they dispatch a fraction of it, and the fraction you let them use determines the asset life.
What the data says about banding
We ran a 34-month matrix on 1,100 semi-solid prismatic cells across four operating bands at 25 °C:
- 0–100% SoC: 2,150 equivalent full cycles to 80% capacity retention
- 10–90% SoC: 3,480 cycles to 80%
- 20–80% SoC: 5,120 cycles to 80%
- 30–70% SoC: 6,700+ cycles to 80% (test still running)
The relationship is not linear — compressing the band by 20 percentage points roughly doubles cycle life in the 10–90% region. Calendar aging behaves the same way: cells held at 30–70% SoC and 25 °C lost 1.1–1.4% capacity per year, while cells held at 90–100% SoC and the same temperature lost 3.2–4.1% per year.
How I set the band in a real project
For a merchant arbitrage project you are paid on energy throughput, so I recommend a 15–85% dispatchable band with a 10% reserve held below and above for grid-services headroom and SoC drift. That gives a 70% usable window on nameplate, which is honest to model and survives the audit. For a backup or resilience application, where cycles are rare and readiness is everything, I hold 40–60% and never let the pack below 30%: the cell spends its life at the flattest, lowest-stress point of the OCV curve, and the standby degradation rate drops below 1% per year.
Two implementation details matter. First, the BMS must track SoC with a coulomb count corrected by a periodic OCV read, and for semi-solid cells the OCV curve between 30% and 70% SoC is flatter than LFP: we measure 4–7 mV per 10% SoC versus 12–18 mV for LFP. That means the OCV correction needs a longer rest window — 45–60 minutes rather than the 20–30 minutes that works for LFP — or the correction will chase noise. Second, the capacity audit has to be a full RPT at 0.05C every 12 months, not a BMS estimate, or the warranty conversation in year eight gets unpleasant.
Cold-Climate Siting: The Heating Budget Nobody Models
I have commissioned semi-solid storage in Inner Mongolia, northern Hokkaido and Alberta. In every one of those projects the cold, not the heat, was the reason the first-year revenue missed the model.
Charge acceptance is the binding constraint
Semi-solid cells charge poorly below 0 °C. At −10 °C with a 0.2C constant-current charge from 20% SoC, our cells accept 71–79% of the nominal charge before hitting the 3.60 V taper, versus 46–58% for the LFP reference. That is a real advantage, but it is not free charging. Below 5 °C we enforce a preheat-to-15 °C gate before any current above 0.05C is allowed. On a 2.4 MWh container with 60 mm of mineral-wool insulation (U ≈ 0.42 W/m²·K), holding 15 °C at −25 °C ambient costs 2.8–3.6 kW continuous, or 67–86 kWh per day. At a 0.35 USD/kWh overnight tariff that is 24–30 USD per day, roughly 8,800–11,000 USD per year, per container.
Three siting rules that work
- Bury the thermal mass. Partially below-grade or earth-bermed enclosures cut the heating load by 30–45% because the ground stays near 8–12 °C at 2 m depth year-round.
- Recover inverter and transformer losses. A 430 kW power block at 97.5% efficiency sheds about 10.8 kW of heat during discharge. Ducting that into the battery compartment covers most of the heating demand on winter discharge days and is worth 1.5–2.2% of annual RTE.
- Model the derate explicitly. At −20 °C, with cells preheated to 15 °C, usable energy drops 6–9% and available power drops 18–24% relative to 25 °C nameplate. Put those numbers in the capacity contract or you will be buying replacement power in February.
Rack-to-Container Mechanical Design and Thermal Zoning
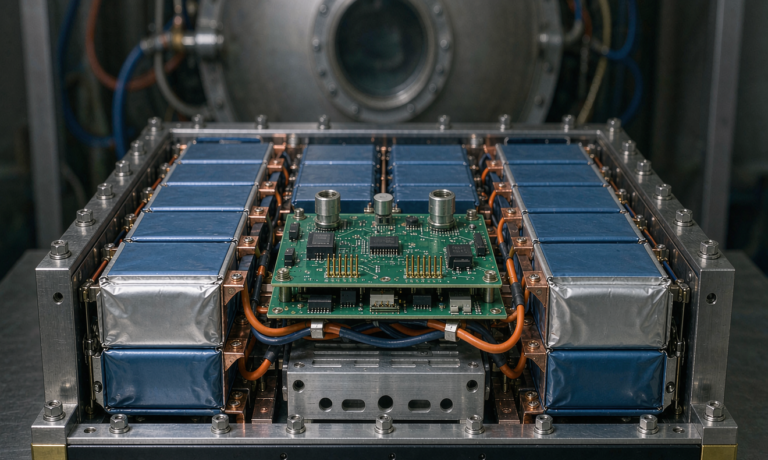
Once the electrical duty cycle is fixed, the mechanical design follows. For eight-hour semi-solid systems I standardise on a 1.6 MWh rack block of 8 modules, each 52 cells in series, giving a 1,248 V nominal DC bus. That bus voltage keeps the current under 350 A at rated power, which allows 95 mm² cable and a single-pole service disconnect per rack rather than the 240 mm² parallel runs a 400 V architecture would need.
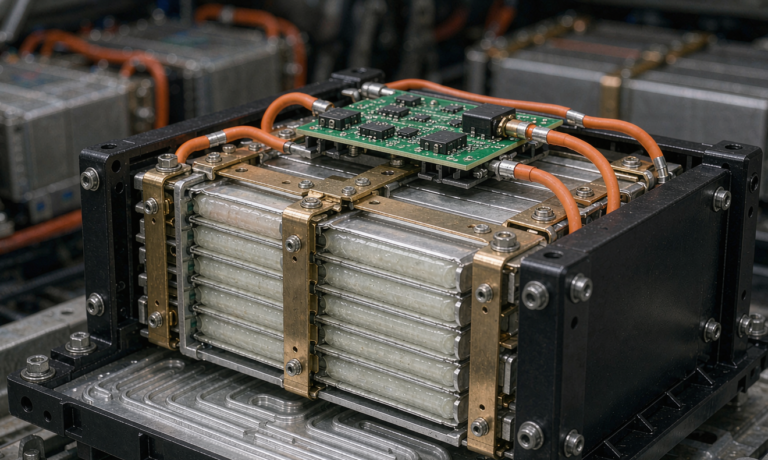
Thermal zoning is where semi-solid differs from liquid cells. Because the gel electrolyte is more viscous and more temperature-sensitive, we hold the cell-to-cell gradient to ≤3 °C across a module and ≤5 °C across the container, tighter than the ≤5 °C / ≤8 °C I would accept for LFP. In practice that means a liquid cold plate per module with 0.8–1.2 L/min flow and a 3–4 °C coolant rise, plus a variable-speed pump that follows the rack delta-T rather than running at fixed speed. At 0.125C the heat generation is only 2.8–4.1 W per cell, so the cooling system is oversized by design and spends most of its life at 15–25% pump speed — which is exactly what you want for a 15-year asset.
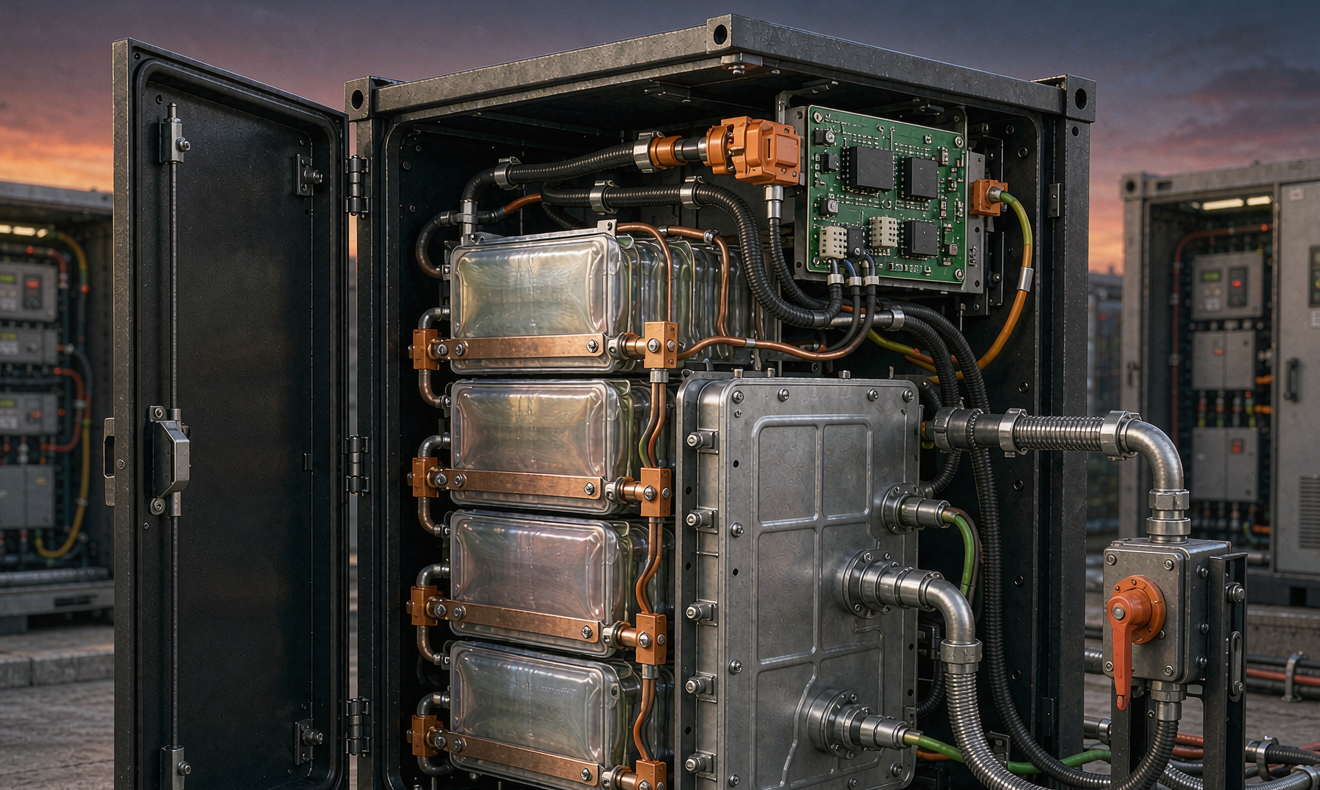
Cell-to-container ratio is the number that shows whether a design is honest. For eight-hour semi-solid systems we deliver 3.6–4.1 MWh of cell capacity per 40-ft container, or 62–68% of the enclosure volume once you subtract the thermal system, the fire suppression cabinet, the HV compartment and the 900 mm maintenance aisle. Anyone quoting 6 MWh in a 40-ft box at eight-hour rate is quoting a one-hour pack with a different inverter.
Compliance, Testing and Acceptance Gates
Storage projects live and die on certification. Every semi-solid state battery pack we ship for stationary use carries UN 38.3 transport test documentation (T.1 through T.8), and the cells are certified to IEC 62619 for industrial applications. At system level the governing documents are UL 1973 for the battery, UL 9540 and UL 9540A for the energy storage system and its thermal runaway propagation characterisation, and NFPA 855 for installation spacing and fire protection. In China we additionally test to GB/T 36276, which requires a 0.5C, 1,000-cycle test with a defined capacity-retention threshold and is stricter than most buyers realise.
For the eight-hour semi-solid architecture, UL 9540A module-level testing has been straightforward: in four separate campaigns the gel-polymer cells did not propagate beyond the initiating module, with a maximum external surface temperature of 148–176 °C and no rupture of the module vent path. That result is a direct consequence of the reduced free-electrolyte fraction and is a genuine safety argument for the chemistry, not marketing.
My standard acceptance gates before a container leaves the factory:
- Measured capacity at 0.125C and 25 °C ≥ 98% of nameplate on a full RPT
- DCIR spread across all modules ≤ 8% of mean
- Cell voltage spread at end of discharge ≤ 120 mV
- RTE at rated power ≥ 88% at the AC terminals
- Thermal gradient at end of an eight-hour discharge ≤ 5 °C
- Insulation resistance ≥ 500 Ω/V on both DC buses, tested at 1,000 V
- BMS data-logging completeness ≥ 99% over a 72-hour soak
FAQ
Is a semi-solid state battery worth the premium over LFP for eight-hour storage?
Only if your revenue model values calendar life and safety. At 118–142 USD/kWh versus 92–115 USD/kWh for LFP, the semi-solid pack costs roughly 22–28% more up front. It pays back when the project horizon exceeds about 12 years, when the site is capacity-constrained so volumetric density matters, or when the local authority applies NFPA 855 spacing rules that reward a non-propagating chemistry. For a 6-year merchant play, buy LFP.
How much usable capacity should I contract on a 4 MWh nameplate system?
With a 15–85% dispatch band, plan on 2.7–2.8 MWh usable at beginning of life, derating to about 2.4 MWh at end of warranty. Always contract on usable energy at the AC terminals, not on DC nameplate, and always specify the ambient temperature at which that number is guaranteed.
Can semi-solid storage cycle twice a day?
Yes, but then you have bought the wrong asset. Two full cycles per day is a 0.25C average rate and roughly 730 equivalent full cycles per year; a semi-solid pack in a 20–80% band will deliver 5,000+ cycles, so you will reach end of life in about seven years. If your revenue stack needs two cycles a day, the LFP economics win and the semi-solid premium is wasted.
What is the real parasitic load of the thermal system?
Budget 2–2.5% of dispatched energy at temperate ambient and 4.5–6% in hot climates. In cold climates add the heating load separately: 60–90 kWh per day per container at −25 °C ambient with 60 mm insulation, unless you site below grade or recover inverter waste heat.
How often should capacity be re-verified?
Run a full 0.05C RPT every 12 months and a partial 0.25C verification every quarter. Semi-solid cells have a flat OCV curve in the 30–70% SoC region, so BMS-estimated capacity drifts 3–5% from measured capacity if you never do a full RPT, and that drift is what warranty disputes are made of.
Does the reduced electrolyte content affect transport classification?
Not the classification — semi-solid cells still ship as UN3480 / UN3481 lithium-ion and still require UN 38.3 test summaries — but it does change how we ship them. With 6–9% free electrolyte instead of 18–22%, the cells qualify for a lower state-of-charge shipping exemption in several jurisdictions, which has cut our inland freight cost by 12–19% on long routes.
What is a realistic timeline from order to energisation?
For a standard 3.4 MWh eight-hour block: 14–18 weeks cell production, 4 weeks system integration, 2 weeks factory acceptance testing, 5–9 weeks shipping and site works. Plan for 26–32 weeks end to end, and order the medium-voltage transformer in week one because that is the item that always slips.