Semi-Solid State Battery Degradation Mechanisms Explained
I have spent the last four years pulling semi-solid cells apart after they failed. Not the dramatic failures
thermal runaway, venting, fire but the quiet ones: a pack that came back from the field with 78% of its
original capacity after 900 cycles, or a module that looked perfect on the outside and had lost 40% of its
power capability. Almost every one of those cases traces back to a degradation mechanism that somebody on the
design team assumed would behave the same way it does in a conventional liquid lithium battery. It does not.
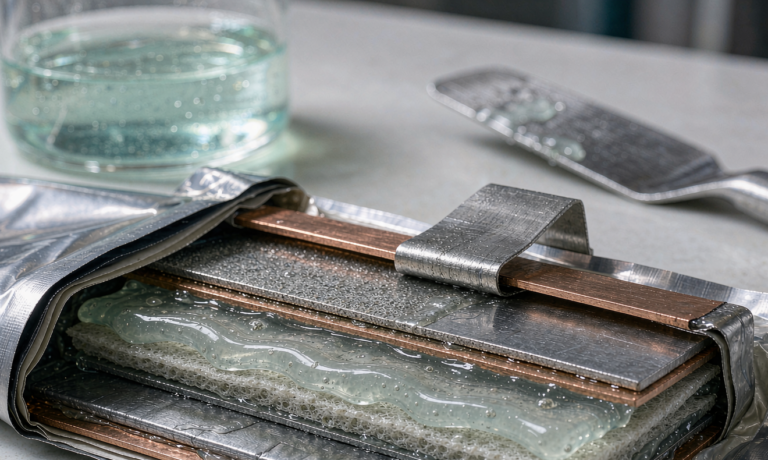
A semi-solid state battery replaces most of the free liquid electrolyte with a gel or semi-solid polymer
host. That single change fixes a lot of safety problems and creates a new family of failure modes, because the
thing that used to heal small damage free electrolyte flowing into a crack, re-wetting a delaminated surface is
no longer there. This article walks through the mechanisms we actually measure on the bench, the numbers we
see, and the design choices that move them.
Why Degradation Looks Different in a Semi-Solid Cell
In a conventional lithium-ion cell, 20 to 30 wt% of the mass is free liquid electrolyte. It acts as a
buffer: when an electrode particle cracks or an interface dries out locally, liquid wicks back in and restores
the ionic path. In a semi-solid cell we run 8 to 14 wt% free liquid, the rest being a gel polymer host. Ionic
transport still works bulk conductivity of a good gel lands in the 1 to 4 mS/cm range at 25°C versus 8 to
12 mS/cm for a carbonate liquid but the self-healing reservoir is largely gone.
The practical consequence is that semi-solid degradation is far more mechanical than a liquid cell’s.
Interface contact, stack pressure, and dimensional stability dominate the second half of life. I tell customers
this in the first meeting: if you take a semi-solid cell and mount it in a pack structure designed for a
liquid lithium battery, you will lose 30 to 50% of the cycle life and there will be no visible defect to
point at. The cell is fine; the mechanical environment is not.
The Gel Electrolyte Interface: Where Semi-Solid Cells Actually Fail
The dominant early-life mechanism is interfacial: the boundary between the gel electrolyte and the electrode
coating. Two things happen there.
First, the solid electrolyte interphase (SEI) on the anode grows. On our cells we measure roughly 2 to 4 nm
of additional SEI thickness per month at 25°C and 50% state of charge, rising to 6 to 10 nm per month at
45°C. SEI growth consumes cyclable lithium and adds interfacial resistance. In the first 100 cycles this
costs about 0.5 to 1.5% of capacity; after that the growth follows a square-root-of-time law and slows
significantly, which is why capacity fade curves flatten after the initial knee.
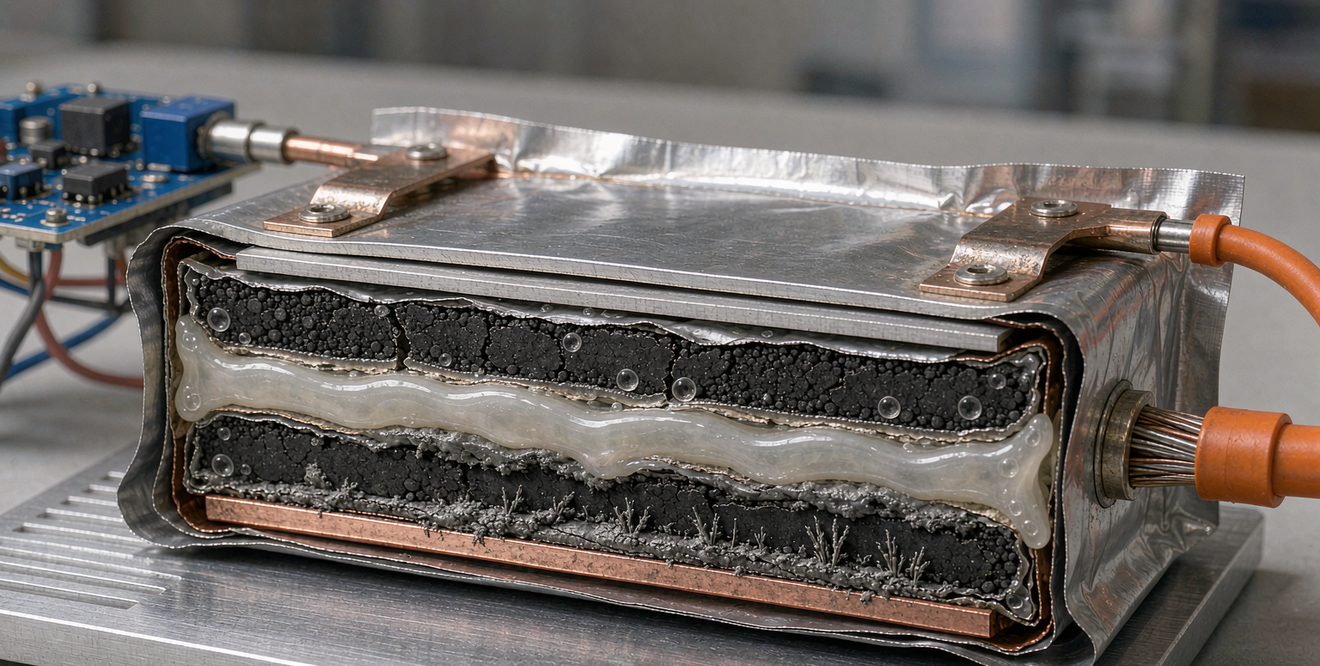
Second, and more specific to this chemistry, the gel physically retracts from the electrode surface as the
electrode breathes. Every charge and discharge cycle expands and contracts the coating: roughly 5 to 7%
volumetric swing for NMC811, 2 to 3% for LFP, and considerably more for silicon-blended anodes. Over a few
hundred cycles, that cyclic strain opens sub-micron gaps at the interface. In a liquid cell the electrolyte
refills them. In a semi-solid cell the gap becomes electrochemically dead area, and the local current density
on the remaining contact area goes up, which accelerates plating locally.
This is the mechanism behind a signature we see constantly: capacity fade stays modest while DC internal
resistance climbs steeply. A cell that lost 12% of its capacity but doubled its 1 kHz ACIR is telling you the
interface is delaminating, not that the active material is gone.
Lithium Plating and the Stack-Pressure Coupling
Lithium plating occurs when the anode potential drops below 0 V versus Li/Li+, so incoming lithium deposits
as metal instead of intercalating. It is a kinetic competition, and the three variables that decide it are
temperature, C-rate, and local pressure.
On our 270 to 340 Wh/kg semi-solid cells, we find the plating onset at about 0.7C when the cell is below
15°C, about 1.2C at 25°C, and above 2C at 45°C. Those numbers are not universal they depend on
anode loading and gel conductivity but the shape of the curve is. Plated lithium is partly reversible, but the
portion that becomes electrically isolated (“dead lithium”) and the portion that reacts into fresh SEI are
permanent losses. Both consume inventory and both increase resistance.
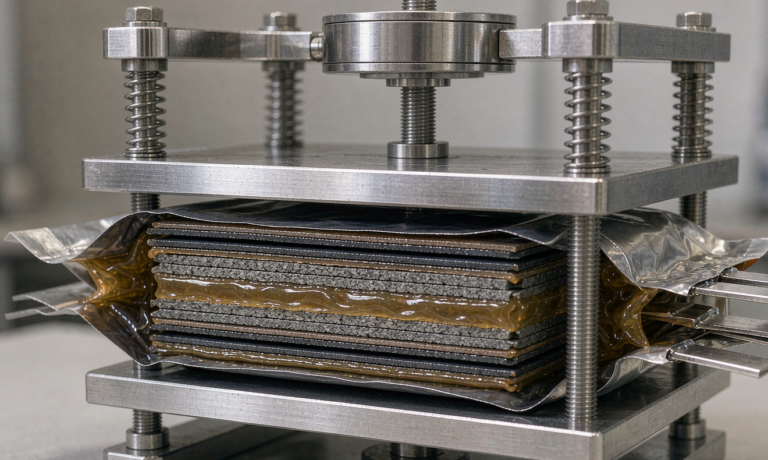
Stack pressure is the part most pack designers miss. Semi-solid cells need a compressive load, typically
0.1 to 0.5 MPa, to keep the gel in conformal contact with the electrodes. Below roughly 0.05 MPa, interfacial
impedance rises 30 to 60% within a few hundred cycles. Above about 1.0 MPa, you start squeezing gel out of the
separator pores and closing ionic pathways, and the cell loses rate capability instead of capacity. The window
is real and it is narrow.
We detect plating onset three ways in parallel: a drop in coulombic efficiency below 99.5% on a slow
reference cycle, an 8 to 12% rise in 1 kHz impedance per 100 cycles, and a shifting peak in the dV/dQ or
incremental capacity curve. Any one of them alone is ambiguous. All three together is plating, and it is time
to change the charge profile.
Cathode-Side Mechanisms: Particle Cracking, Dissolution, and Gas
On the cathode side, three mechanisms matter in field service.
- Particle cracking. NMC secondary particles fracture under repeated lithiation strain,
especially above 4.2 V and above 2C. In a liquid cell the fresh crack surfaces get wetted and stay partially
active. In a semi-solid cell they largely do not, so each cracking event converts active material into inert
filler. We budget an extra 0.02 to 0.05% capacity loss per cycle once cracking starts. - Transition-metal dissolution. At 45°C and sustained voltages above 4.15 V, we measure
20 to 60 ppm of dissolved nickel and manganese in the electrolyte phase. Those ions migrate to the anode and
catalyse further SEI growth. This is why high-voltage operation is punished twice: once at the cathode and
once at the anode. - Gas generation. Residual carbonate and additive decomposition produce CO2 and CO. Typical
pouch swelling is 2 to 5% of thickness during formation and 6 to 9% after 1000 cycles at 45°C. Swelling is
not cosmetic it redistributes the stack pressure and can lift the cell away from a cooling plate, which starts
a thermal feedback loop.
The interaction is what makes this hard. A pack that runs hot gets dissolution, which thickens the anode
SEI, which raises resistance, which raises temperature. Semi-solid cells tolerate a hot start better than
liquid cells in safety terms the self-heating onset is 165 to 180°C versus 110 to 140°C for NMC811
with liquid electrolyte but they do not tolerate it better in life terms.
Calendar Fade vs Cycle Fade: The Measured Numbers
Customers almost always ask for one cycle-life number. I give them two curves, because the two mechanisms
are additive and behave differently.
Calendar fade at 50% state of charge: 1.5 to 2.5% per year at 25°C, 3.0 to 4.5% per year at 37°C,
and 6 to 8% per year at 45°C. The temperature coefficient is roughly Q10 = 2 to 2.5 the rate doubles for
every 10°C. Storage at 100% SOC and 40°C for a single year costs 9 to 11%.
Cycle fade at 25°C: 1000 to 1500 cycles to 80% capacity at 100% depth of discharge, 2000 to 3000 cycles
at 80% DoD, and 10000 to 15000 shallow cycles at 10% DoD. The shallow-cycling number surprises people, and it
is the single biggest lever available in system design. A semi-solid pack operated in a 30 to 80% SOC band will
outlast the same pack operated 0 to 100% by more than a factor of two, with a modest penalty in usable energy.
End of life is defined two ways in our specifications and both must be checked: 80% of nominal capacity, or
a doubling of DC internal resistance from beginning-of-life. Whichever arrives first wins. On cells that
delaminate, resistance arrives first.
Mechanical Degradation: Pressure Relaxation and Delamination
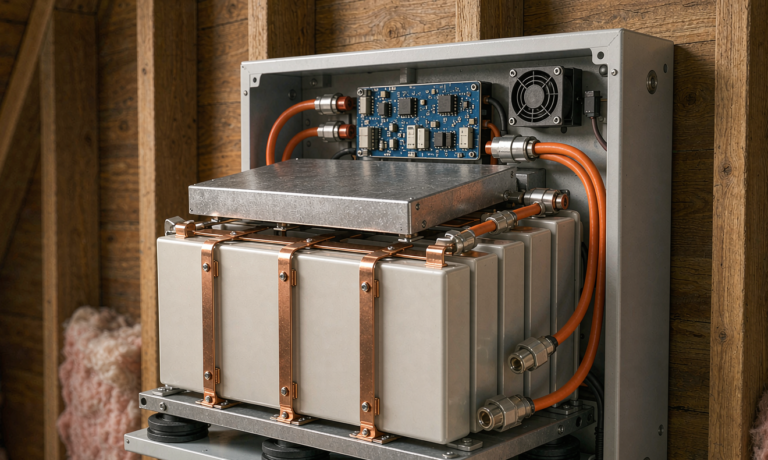
Every compression scheme relaxes. If you use a compliant foam to hold 0.2 MPa, expect 15 to 25% preload loss
over 1000 cycles as the foam creeps and the cell breathes. A wave-spring stack holds the same preload within
about 10%. The difference in end-of-life capacity between the two is routinely 8 to 12 percentage points on
the same cell. Under IEC 60068-2-64 random vibration plus 5 to 15 g shock, a poorly preloaded stack shows
intermittent contact, which looks on telemetry like random millisecond voltage dips. If you see those, check
mechanical preload before suspecting the electronics.
How We Model and Test Degradation on the Bench
We build a life model from a factorial matrix rather than a single curve. The standard matrix for a new
semi-solid cell is temperature (25 / 45 / 60°C), rate (0.5C / 1C / 2C), depth of discharge (10 / 80 /
100%), and stack pressure (0.05 / 0.2 / 0.5 MPa). Every 100 cycles we interrupt and run a reference
performance test at 0.2C and 25°C so that capacity and resistance are measured under identical conditions
each time.
From the reference tests we extract three decoupled indicators: capacity fade from the 0.2C discharge,
resistance growth from a 10-second DC pulse and from 1 kHz ACIR, and lithium inventory versus active-material
loss from incremental capacity analysis. Separating inventory loss from active-material loss is what tells you
whether to fix the charging profile or the mechanical design. I have seen teams spend months optimising a
charge algorithm for a problem that was actually stack pressure.
For qualification we follow IEC 62619 and IEC 62133-2 for safety, UN38.3 for transport at 30% SOC or less,
and UL 9540A where the pack goes into a stationary installation. Life-test practice follows the SAE J2288
philosophy of periodic reference testing even when the cell is not automotive, because it is the only way to
get comparable numbers.
Design Rules That Actually Extend Semi-Solid Life
Ranked by measured benefit on our own packs, these are the decisions that move the curve:
- Limit the SOC window. Operating 10 to 90% instead of 0 to 100% roughly doubles cycle life
for about 20% less usable energy. Best return of anything on this list. - Cap the charge voltage. Charging to 4.15 V instead of 4.20 V costs about 8% of usable
energy and extends cycle life by roughly 40%, because it cuts both particle cracking and metal dissolution. - Hold the pressure. A spring preload inside 0.1 to 0.5 MPa, verified at end of line and
again at 500 cycles, is worth more than any electrolyte tweak. - Control the temperature. Keeping cells at 25 to 30°C instead of 40 to 45°C
changes calendar fade from 6 to 8% per year down to under 2.5%. - Rate-limit when cold. Below 15°C, cap charge at 0.5C or preheat. Plating damage from
a single winter is not recoverable in summer. - Formation discipline. Slow first cycles at 0.05C then 0.1C, controlled temperature, and a
proper degas step. Formation sets the SEI you live with for the next decade.
None of this is exotic. It is mostly restraint: less voltage, less depth, less heat, less current when cold.
The teams that get 3000 cycles out of a semi-solid pack are not the ones with the cleverest chemistry; they are
the ones who specified the operating envelope honestly and then built a battery management system that
enforced it.
Frequently Asked Questions
What is the main degradation mechanism in a semi-solid state battery?
Interfacial degradation at the gel-electrolyte to electrode boundary. Because only 8 to 14 wt% free liquid
remains, the cell cannot re-wet delaminated or cracked surfaces the way a conventional liquid lithium battery
does. In practice this shows up as rising internal resistance before it shows up as lost capacity.
How many cycles does a semi-solid state battery last?
At 25°C and 100% depth of discharge, 1000 to 1500 cycles to 80% capacity is typical. At 80% DoD that
rises to 2000 to 3000 cycles, and shallow 10% DoD operation can exceed 10000 cycles. Temperature is the
dominant variable: at 45°C the 100% DoD figure drops below 800 cycles in most designs we have tested.
Why does stack pressure matter so much for semi-solid cells?
The gel electrolyte needs compressive contact with the electrode coating to maintain a low-resistance ionic
path. Below about 0.05 MPa the interface delaminates and impedance climbs 30 to 60% within a few hundred
cycles. Above about 1.0 MPa the gel is squeezed out of the separator pores and rate capability falls. The
usable window is roughly 0.1 to 0.5 MPa, and it must be maintained over life, not just at assembly.
Can lithium plating in a semi-solid battery be reversed?
Partially. A fraction of plated lithium re-intercalates during rest or discharge, which is why plating often
shows up as a temporary capacity dip. The portion that becomes electrically isolated and the portion that
reacts into fresh SEI are permanent. Slow charging and warming the cell are the only reliable cures; there is
no recovery algorithm.
Does a semi-solid state battery degrade faster than LFP?
In cycle life, yes in most comparisons: LFP routinely delivers 4000 to 6000 cycles at 25°C against
1000 to 1500 for a high-nickel semi-solid cell. The trade is energy density LFP sits at 150 to 180 Wh/kg while
semi-solid cells reach 270 to 340 Wh/kg. If the application is weight-limited, semi-solid wins; if it is
cycle-count-limited, LFP wins.
What temperature should a semi-solid battery be stored at?
As close to 25°C as possible, at 30 to 50% state of charge. Calendar fade runs 1.5 to 2.5% per year at
25°C and 6 to 8% per year at 45°C. Storing at 100% SOC and 40°C costs 9 to 11% in a single
year, and that loss is not recovered by later cycling.
How do you detect semi-solid degradation before it becomes a failure?
Track three signals together on a periodic 0.2C reference cycle: capacity, 1 kHz ACIR and 10-second DCIR,
and the incremental capacity or dV/dQ curve. Rising resistance with modest capacity loss points to
delamination or pressure loss; capacity loss with flat resistance points to lithium inventory consumption from
SEI growth. The two need different fixes.
Which standards govern semi-solid battery life and safety testing?
IEC 62619 and IEC 62133-2 cover safety for industrial and portable applications, UN38.3 governs transport
at 30% SOC or less, UL 9540A covers thermal propagation for stationary installations, and SAE J2288 is the
usual reference for life-test methodology with periodic reference performance tests.
What This Means for Your Next custom battery solution
Semi-solid chemistry is not a drop-in substitute. It rewards teams that treat the cell as a mechanical
component as much as an electrochemical one. When a customer comes to us for a custom battery solution, the
first three questions we ask are not about capacity at all: what is the real duty cycle, what is the
worst-case ambient temperature, and how will you hold compression for ten years. Answer those honestly and a
semi-solid pack will outperform anything else at the same weight. Ignore them and the same cells will
underperform a commodity lithium battery that cost half as much.
The mechanism list above is also, usefully, a commissioning checklist. Verify preload, verify the SOC window,
verify the cold-temperature charge limit, and set up a quarterly reference test. Those four things catch
almost every degradation mode early enough to act on.
Further Reading
References