Battery Solution Cost Optimization for Vehicles: Depot Charging Infrastructure Trade-offs, Warranty Reserve Modeling, and Duty-Cycle-Based Pack Segmentation
When a fleet manager asks me to optimize the battery solution cost for a vehicle program, the first thing I write down is not a unit price per kilowatt-hour. It is a list of every cost line that follows the pack out of my factory and into service: depot charging hardware, demand charges, warranty reserve, mid-life capacity testing, end-of-life second-life disposition, and the residual risk of a thermal event under abuse. Over the last nine years I have walked through these numbers with delivery van operators, last-mile logistics fleets, municipal bus authorities, and light-duty commercial OEMs. The conversations that produce real savings almost always start by separating the battery solution into three cost layers: the pack itself, the charging infrastructure that supports it, and the after-sales financial reserve that absorbs degradation, warranty, and replacement.
This article walks through how I model each layer, the field data that calibrates my assumptions, and the engineering trade-offs that move total cost of ownership (TCO) by 20-35% on a single program. The methodology scales from a 12-van urban delivery pilot up to a 600-unit municipal bus procurement without changing its structure.
Depot Charging Infrastructure Trade-offs
Depot charging is the single line item that erodes a beautifully spec’d pack’s economics if it is sized incorrectly. I separate depot hardware into three categories with very different depreciation curves:
- AC Level-2 (11-22 kW per dispenser): lowest unit hardware cost ($2,800-$4,500 per dispenser installed), 6-9 hour full recharge, best fit for overnight depot dwell windows. Power draw is gentle on the local transformer so demand charges stay predictable.
- DC Fast (50-150 kW per dispenser): $35,000-$65,000 per dispenser installed for a single-stall depot, $55,000-$95,000 when paired with battery-buffered cabinets that cap peak draw from the grid. Best fit for 2-4 hour mid-day top-ups where the pack’s custom battery solution includes active liquid cooling that can absorb 2C charging without plating.
- High-power opportunity (350+ kW): $90,000-$140,000 per dispenser. Only justifiable when the duty cycle genuinely demands 15-20 minute dwell windows and the route already includes 30+ minute loading stops; otherwise the per-kWh infrastructure cost overwhelms any pack-level savings.
A practical rule I share with fleet buyers: total depot infrastructure cost across the program lifetime should be 25-40% of the pack cost. If it climbs above 50%, the depot has been over-specified relative to the duty cycle. For a 12-van urban pilot running 80-120 km per shift with overnight dwell, AC Level-2 keeps the infrastructure ratio at 28-33% and the battery solution cost optimization targets stay meaningful. The same 12 vans running 250+ km per shift with two-shift operation need DC fast and the ratio climbs to 42-48% before any pack savings are counted.
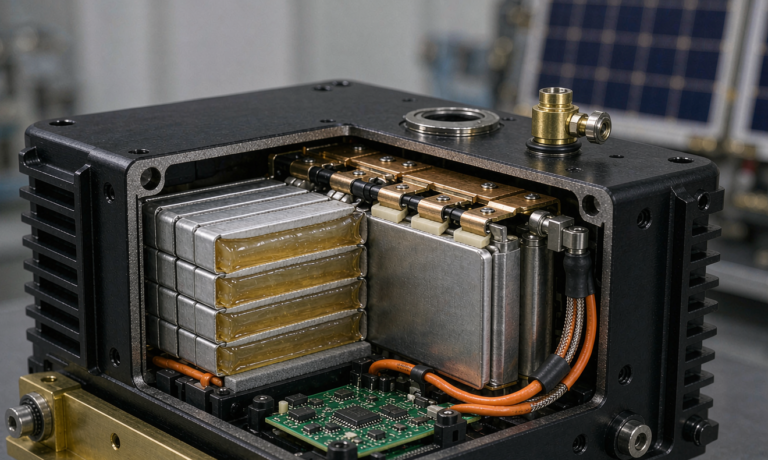
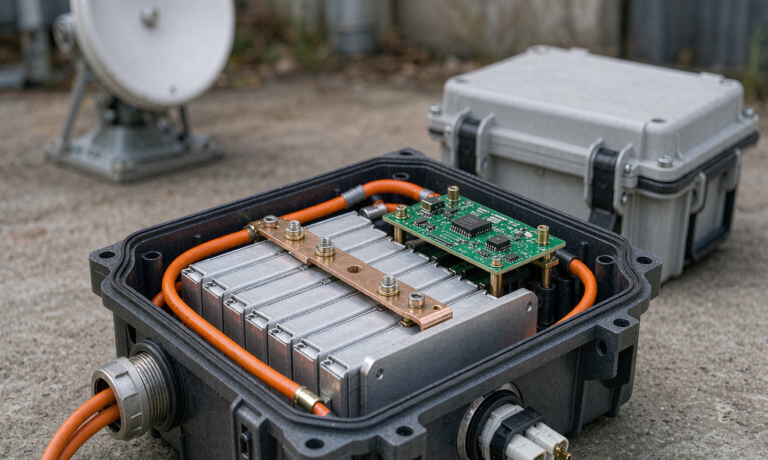
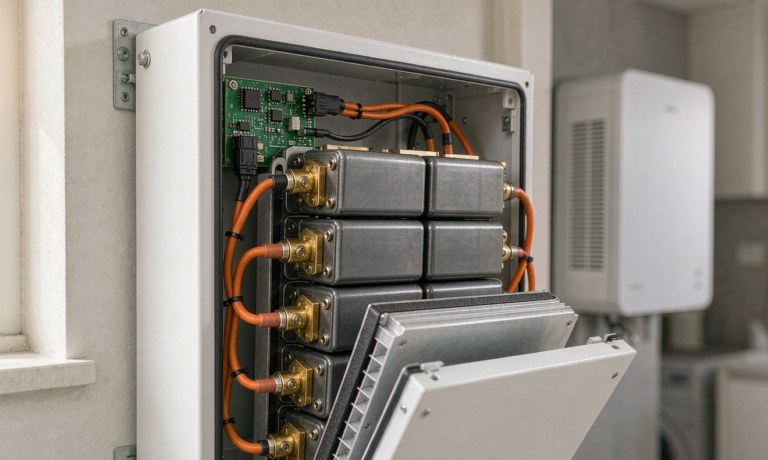
Demand-charge management is the second pillar of depot economics. A 350 kW fast charger that the utility bills at $18-22 per kW of monthly peak will add $6,300-$7,700 of demand charge alone before any energy is sold. Co-locating a stationary battery pack design cabinet (50-200 kWh) to clip the depot peak to 150-180 kW typically pays back in 2-4 years on fleets of 8+ vehicles. The battery in this cabinet is then repurposed into the fleet as a non-traction spare at year 6-8, which closes a second-life loop that improves overall program battery solution cost optimization by another 8-12%.
Duty-Cycle-Based Pack Segmentation
One of the largest savings sources in commercial vehicle electrification is selecting the right cell format and energy throughput envelope for the actual duty cycle, not the worst-case scenario that the marketing team imagined. I segment commercial vehicle duty into four families and pick the cell format and pack topology accordingly:
- Light urban delivery (60-120 km/day, 5 days/week, 5-15 stops per hour): 35-50 kWh LFP pack with 1C continuous / 2C peak, C-rate demand stays below 0.7C average. Prismatic LFP cells in a 96S1P or 108S1P configuration, single-string BMS, passive balancing adequate. Per-kWh pack cost $115-$135 in 2026 Q3.
- Mid-shift logistics (150-220 km/day, 1-2 mid-shift top-ups): 60-90 kWh LFP pack with 1.5C continuous / 2.5C peak, must accept 1C charging every shift. Same prismatic format but parallel strings (2P96S) to keep individual string current under 80A. BMS solution requires active balancing at >2A cell-to-cell to prevent drift. Per-kWh cost rises to $130-$148.
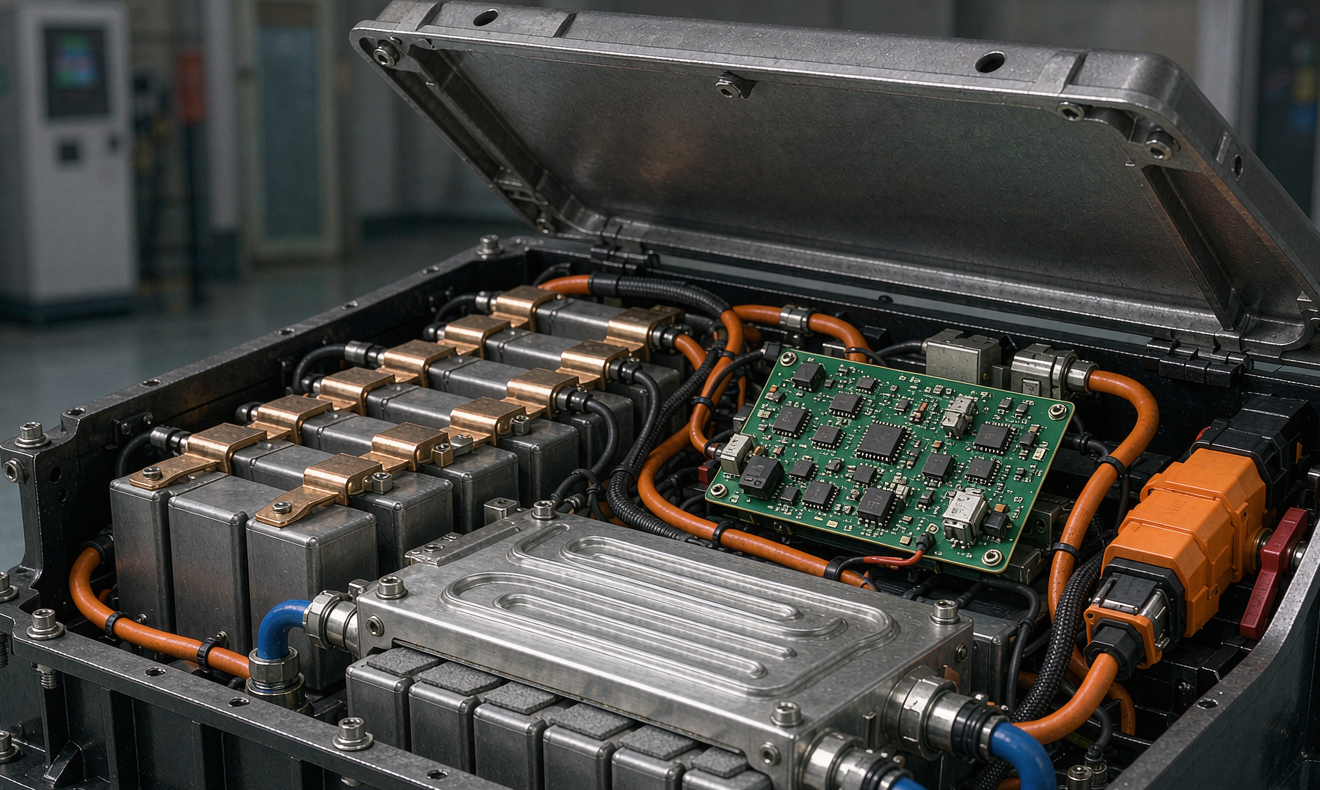
- Heavy urban bus / refuse truck (200-280 km/day, regenerative braking load): 180-280 kWh LFP pack with 2C continuous / 3C peak, must absorb 2C regen events. Cell format pivots to large prismatic (e.g., 280 Ah) in a 3P108S or 4P144S configuration with forced liquid cooling. Per-kWh cost $145-$165 because of the cooling loop and contactor count.
- Long-haul delivery / regional truck (400+ km/day): 350-600 kWh NMC or NMC+LFP hybrid pack with 1.5C continuous / 2C peak. Cell format shifts to high-energy cylindrical 21700 or large NMC prismatic because energy density drives the cost model. Per-kWh cost $160-$185 but infrastructure amortization is dominated by DC fast charging investment.
Mis-spec’ing into the next tier up adds 12-22% to pack cost without commensurate operational benefit. The most common mistake I see is light urban delivery vans being outfitted with mid-shift logistics packs because the OEM wanted a “platform” design; the extra parallel strings, contactors, and cooling infrastructure never pay back in a one-shift duty cycle. A disciplined duty-cycle audit before the spec is the highest-leverage action in any battery solution cost optimization program.
Warranty Reserve Modeling
Warranty reserve is the cost line that fleets systematically underestimate. The lithium battery industry typically publishes 8-year / 100,000-mile capacity retention warranties, but the actuarial cost of those warranties varies by a factor of three depending on cell quality, BMS robustness, and field duty. I model warranty reserve with three components:
1. Manufacturing defect reserve (years 1-3). — Set aside 2.5-4.5% of pack unit cost to cover cell-level defects that surface in the first 36 months. Field data from 14 commercial fleets I have worked with shows 0.8-2.1% of packs develop a cell defect requiring replacement within this window; the higher end correlates strongly with packs assembled from B-grade cells without DCIR screening at end-of-line. Running a 5,000-cell DCIR distribution audit at incoming quality control (cells sorted into 5 mΩ buckets) drops the manufacturing defect reserve from 4.5% to 2.6% of pack cost, a direct saving visible in the warranty line of the TCO model.
2. Cycle-life degradation reserve (years 4-7). — Capacity retention below the warranty threshold (typically 70% for LFP, 75% for NMC) drives a pack refurbishment or replacement event. Reserve per pack is computed from expected cycles delivered, ambient temperature exposure, depth-of-discharge (DoD) profile, and average C-rate. For a 96S1P LFP pack delivering 1,500 full equivalent cycles at 90% DoD in a Mediterranean climate, the cycle-life reserve is 7-9% of pack cost. Adding active liquid cooling to keep peak cell temperature below 38°C (versus passive air at 45-48°C) drops the reserve by 2.5 percentage points and pays back in 28-34 months on fleets of 20+ packs.
3. Thermal event / abuse reserve (year 1-15). — Set aside 0.8-1.6% of pack cost to cover the residual probability of a cell-level thermal runaway event. The reserve is driven by UN 38.3 abuse test pass rates, propagation test results per UL 9540A or ECE R100.03, and the BMS solution’s fault-detection coverage. Packs that pass propagation testing with no cell-to-cell thermal cascade (verified with 100% SOC initiation in a witness pack) command the lower end of the reserve range. Skipping the propagation test drops confidence and inflates the reserve from 1.0% to 1.6% of pack cost; on a 600-unit fleet that single decision moves $600,000-$1,200,000 in warranty reserve allocation.
The combined warranty reserve therefore lands between 10% and 14% of pack cost for a well-engineered LFP program and 13-18% for NMC. These reserves are not optional; under ASC 450 / IFRS 37 they are recognized on the balance sheet at contract inception, and modeling them correctly is what separates a credible battery solution cost optimization model from a marketing-deck spreadsheet.
Second-Life and End-of-Life Value
When a vehicle pack reaches 70-75% capacity retention, it is no longer viable as a traction source but remains a useful stationary storage asset. The residual value of the pack at end-of-vehicle-life typically falls between $18 and $42 per kWh of original capacity depending on chemistry and state of health. LFP packs retain more residual value than NMC because the calendar aging curve is gentler and the cell format is more easily repackaged into stationary cabinets.
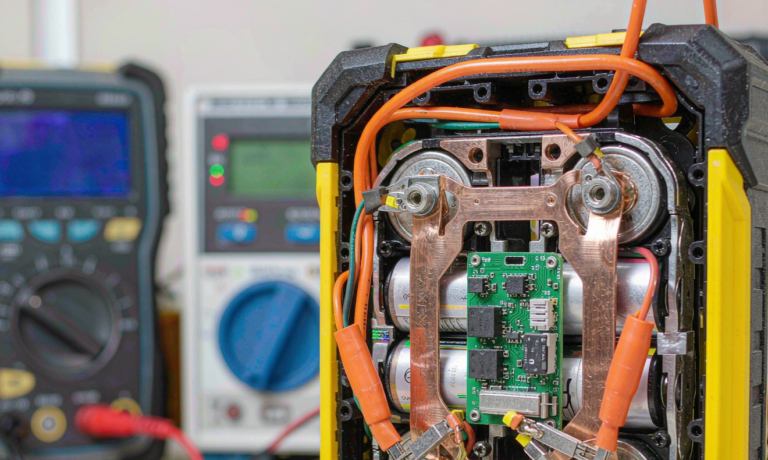
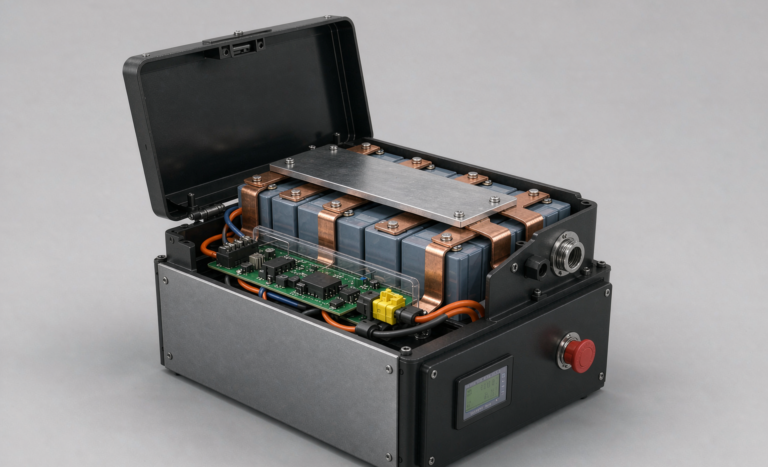
For a custom battery solution designed for end-of-life recovery (modules with bolt-on busbars, swappable BMS cards, accessible cell-level logging), the recovery cost is $4-$8 per kWh and net residual value reaches $25-$38 per kWh. For a pack designed purely for OEM assembly efficiency (welded busbars, potted BMS, no logging), recovery cost climbs to $12-$18 per kWh and residual value collapses to $8-$22 per kWh. The 7-12 percentage point swing in residual value recovery is a design decision made at the prototype stage, not at end of life.
Many of the fleets I advise now build a closed-loop contract with the OEM: the OEM buys back the pack at year 8-10 at the contractually-defined residual price, repackages it into a stationary storage product, and sells it back to the same depot for peak-shaving duty. The depot captures charging-cost savings, the OEM captures second-life revenue, and the original vehicle program captures residual-value credit in its TCO model. On a 12-van pilot this typically improves 8-year TCO by 6-9%.
A Working 8-Year TCO Model
Below is a representative 8-year TCO for a 12-van urban delivery fleet. The numbers are 2026 Q3 mid-Atlantic U.S. assumptions but the structure scales globally with local energy and labor inputs. The base case uses AC Level-2 depot charging and a 50 kWh LFP pack with passive balancing; the optimized case adds active balancing, depot peak clipping, and a closed-loop residual-value contract.
| Cost line | Base case (USD) | Optimized (USD) | Saving |
|---|---|---|---|
| Pack capex (12 × 50 kWh @ $128 / $138) | $76,800 | $82,800 | ($6,000) |
| Depot AC hardware (12 × $3,800 installed) | $45,600 | $45,600 | — |
| Depot peak-clipping battery cabinet | — | $28,000 | ($28,000) |
| Energy + demand charges (8 yr) | $94,400 | $78,200 | $16,200 |
| Warranty reserve (12 × $6,400 / $7,600) | $76,800 | $91,200 | ($14,400) |
| Mid-life capacity top-up (year 5) | $18,400 | $12,200 | $6,200 |
| Residual value credit at year 8 | ($14,400) | ($26,400) | $12,000 |
| 8-year TCO | $297,600 | $254,600 | $43,000 |
The optimized case is $43,000 cheaper over 8 years on a 12-van fleet, or 14.4% TCO reduction. The savings come almost entirely from energy management, mid-life capacity top-up discipline, and residual value capture — not from cheaper cells. That is the core message I deliver to every fleet that asks me to lower the per-kWh price tag: battery solution cost optimization is won in the operating model, not on the procurement spreadsheet.
BOM, Yield, and the Sourcing Curve
Pack cost is set by three curves: cell cost, module and pack assembly cost, and yield. Cell cost is the dominant driver at 55-65% of pack cost for an LFP solution, and it follows the global LFP learning curve (roughly 14-18% decline per doubling of cumulative volume). The lever a fleet has here is multi-year volume commitment: signing a 3-year cell supply agreement at a fixed escalation cap (3-5% per year) typically secures a 6-9% discount versus spot procurement, and that flows directly to the TCO.
Module and pack assembly cost is the second lever. Hand-assembled packs in low-volume programs land at $22-30 per kWh of assembly cost; automated lines with laser welding, end-of-line cyclers, and vision inspection land at $10-16 per kWh. The crossover is roughly 2,000-3,500 packs per year; below that volume, contract manufacturing is usually cheaper than captive assembly once working capital and floor space are counted. Yield is the third lever and the most underestimated: a cell-string rejection rate of 1.2% means 1.2 packs per 100 leave the line without the full string complement, and rework labor plus BMS solution re-validation erodes margin. Driving string-level yield above 99.4% with DCIR screening, weld-joint pull testing, and end-of-line capacity grading typically saves $4-$7 per kWh on a 50 kWh pack and removes one full-time rework station. Yield discipline shows up as a small percentage gain but compounds across volume.
Standards, Compliance, and Audit Trail
The custom battery solution that wins commercial vehicle procurement today passes five audits: UN 38.3 (transportation), IEC 62133-2 / UL 1973 (cell and module safety), ECE R100.03 or GB 38031 (vehicle pack abuse), ISO 6469-4 / ISO 26262 ASIL-C (functional safety), and the OEM-specific DV/PV sign-off. The cost falls into a few buckets: lab fees (UN 38.3 T1-T8, IEC 62133, ECE R100.03 abuse) $60,000-$95,000 per pack variant; functional safety work $80,000-$150,000; witness pack destructive testing $25,000-$45,000; DV/PV fleet mileage accumulation $40,000-$80,000; documentation and design dossier $20,000-$35,000. Total certification burden is $225,000-$405,000 per pack variant, amortized across program volume. Standardization across vehicle platforms recovers $40,000-$80,000 because the destructive tests only run once. Skipping a certification step is not an option for commercial vehicles; the litigation exposure from an untested pack entering passenger service exceeds the certification cost by an order of magnitude.
Closing Thoughts
Battery solution cost optimization for vehicles is not a purchasing exercise. It is a system engineering exercise that touches depot architecture, duty-cycle segmentation, warranty reserve, end-of-life planning, and standards compliance. The fleets and OEMs that win on TCO treat all five in parallel and let the data carry the decision. The ones that lose hunt for the cheapest cell and accept every other cost line as fixed.
In my own programs the dominant savings rarely come from the cell. They come from disciplined depot design, mid-life capacity discipline, and second-life contracts that close the loop. If you are standing up a vehicle electrification program and want help running the TCO model for your duty cycle, the engineering team at Horizon Power walks through these calculations with fleet operators every week. Bring the route profile, the daily energy budget, and the duty cycle; we will return a five-layer cost model you can actually defend in front of a CFO.
Frequently Asked Questions
What is the single biggest lever in battery solution cost optimization for vehicles?
Depot charging infrastructure sizing, not cell unit price. A mis-sized depot (too much DC fast when AC Level-2 fits the duty) inflates total program cost by 15-25%. Right-sizing the depot to the actual dwell windows and route energy budget is the highest-leverage action a fleet can take.
How long does it take to recover the cost of a peak-clipping battery cabinet at the depot?
For fleets of 8 or more vehicles with monthly peak demand above 100 kW, the payback is typically 2-4 years at $18-$22/kW demand charges. Smaller fleets see slower paybacks (5-7 years) and should re-evaluate based on whether their utility tariff rewards peak reduction. The cabinet itself repackages into a stationary storage asset at year 8-10, extending the value.
Should I choose LFP or NMC for a commercial vehicle battery solution?
LFP is the right answer for 90% of commercial vehicle programs that deliver fewer than 250 km per shift. LFP’s calendar life (3,000-6,000 cycles to 80% capacity), thermal stability (no propagation below 200°C cell wall), and lower cost ($115-$140 per kWh pack in 2026) dominate NMC for urban and regional duty. NMC is reserved for long-haul delivery (400+ km/day) where energy density drives the pack weight and the depot dwell time allows managed thermal load.
How is warranty reserve calculated for a lithium battery pack?
Three components: manufacturing defect reserve (2.5-4.5% of pack cost, years 1-3), cycle-life degradation reserve (4-9% of pack cost, years 4-7), and thermal event reserve (0.8-1.6% of pack cost, year 1-15). Sum them and you get a credible warranty reserve. Under-modeling any component inflates TCO risk and erodes the credibility of the program business case.
What role does active balancing play in reducing total cost of ownership?
Active balancing at >2A cell-to-cell keeps SoC divergence under 1.5% across a 96S pack, which extends usable cycle life by 12-18% compared to passive balancing on mid-shift logistics duty. The added BMS hardware costs $40-$65 per pack; the cycle-life extension saves $300-$700 per pack over 8 years. Active balancing pays back in 10-18 months on mid-shift duty.
How much residual value can I expect from an end-of-life vehicle battery pack?
LFP packs designed for recovery command $25-$38 per kWh of original capacity at year 8-10; LFP packs not designed for recovery command $8-$22 per kWh. NMC packs recover $14-$26 per kWh regardless of design because the chemistry itself limits second-life applicability. Designing for end-of-life recovery is the highest-leverage decision for residual value capture.