Battery Solution Performance for Robotics: Opportunity-Charge Duty Windows, State-of-Power Accuracy, and Fleet Runtime Variance Control
Most of the conversations we get about battery solution performance for robotics start with the wrong question. A buyer sends us a nameplate capacity, asks why a fleet is “only” getting a 7-hour run, and wants a bigger pack. The real issue is rarely cell capacity — it is the gap between three different things we call “performance” and a single state-of-charge (SoC) bar that cannot describe any of them. After twenty years specifying custom battery solutions for warehouse AMRs, last-mile AGVs, mobile manipulators, and surgical robots, I can tell you the customers who get predictable shifts are the ones who spec the duty cycle, the state-of-power (SoP) accuracy, and the opportunity-charge behaviour separately, then size the pack against the worst of all three rather than against a sticker-capacity number.
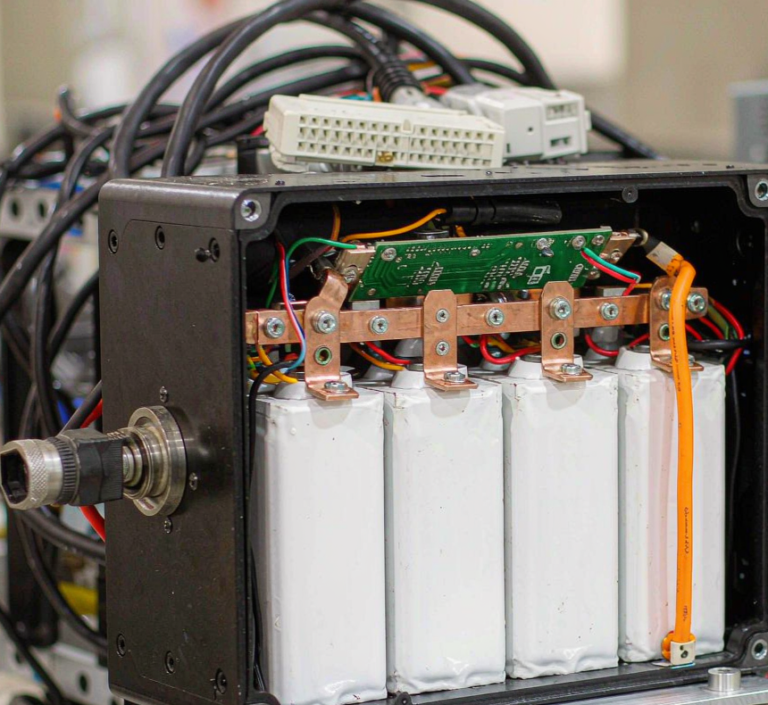
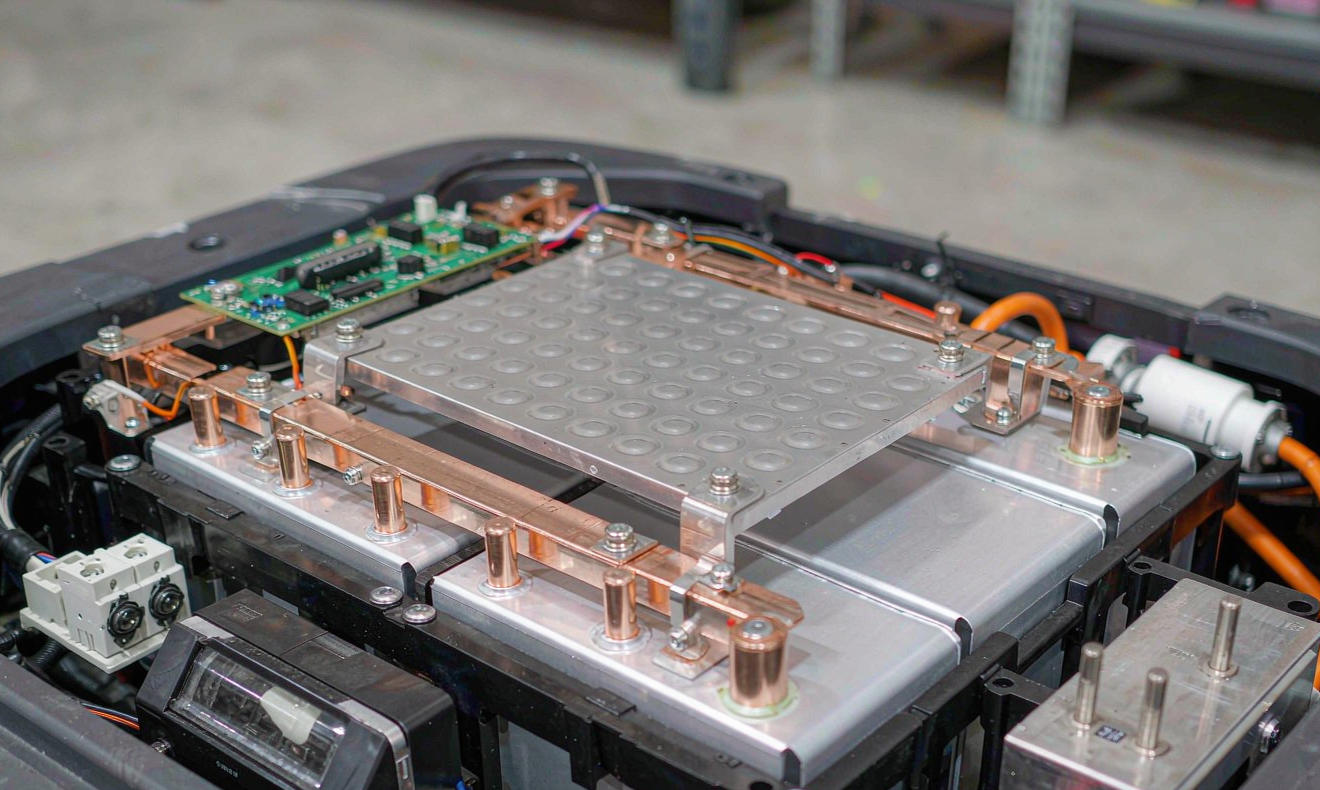
On our integration bench this morning we are looking at a 48 V / 60 Ah LFP pack destined for a third-party AMR platform. The customer wants 9 hours between full charges, 3 kW peak shaving through a hybrid supercapacitor module, and 1C opportunity-charge cycles every 22 minutes during pick-station dwell. None of those three numbers is on the cell datasheet — they are engineering quantities we have to design, measure, and prove. This guide walks through how we think about battery solution performance for robotics from the duty-cycle paper to the run-time variance gate, with the test data and standards that anchor each step.
1. What “performance” actually means for a robot duty cycle
For a humanoid or mobile manipulator, “performance” is at least four orthogonal quantities, and conflating them is the most common cause of a custom battery solution failing its pilot:
- Energy throughput (Wh per shift) — the integrated watt-hours the pack delivers from 100 % to cut-off at the actual operating temperature. This is what the customer usually calls “runtime”.
- Sustained continuous power (W or C-rate) — what the pack can deliver for 30 minutes at a defined SoC window without tripping BMS current limits or running cells above 45 °C.
- Peak power and regen absorption (W) — what the pack can deliver for 2-10 seconds during acceleration, lift, or deceleration regen without violating terminal-voltage or regen-voltage clamps.
- Opportunity-charge throughput (Ah per dwell or kWh per shift) — the partial SoC accepted at the docking contactor without tapering into a thermal problem, multiplied by the number of docks per shift.
The mistake we see most often is sizing only against energy throughput. A 60 Ah pack that delivers 9 hours at 0.3 C average can still fail at hour 3 if a peak-power transient pulls the terminal voltage below the BMS under-voltage gate. On the bench I always start by writing these four numbers down on the same whiteboard before anyone opens a cell catalogue.
2. Building the duty-cycle power budget
The first deliverable for any robotic battery solution design is a measured duty profile, not a modelled one. We attach a current clamp and a four-channel data logger to an in-service unit for at least five shifts, capturing at 1 kHz the bus current, terminal voltage, SoC, and cell-surface temperature at three thermistor locations. We then bin the trace into 8-12 canonical states:
- Idle / dwell — controller awake, drive disabled, typical 0.5-1.5 A quiescent load on a 48 V system.
- Low-speed travel — 0.2-0.4 m/s on smooth VNA floor, 3-8 A average.
- High-speed travel — 1.2-1.6 m/s with 250 kg payload, 18-30 A sustained.
- Acceleration peak — 1.5-3.0 s events at 80-120 A.
- Regenerative braking — -25 to -45 A for 1-2 s.
- Lift or arm actuation — 60-90 A for 4-8 s.
- Opportunity-charge dwell — 30-120 A charge with battery thermal mass at 32-42 °C.
Each state gets a SoC window, a temperature window, and a voltage headroom. We then solve the cumulative energy equation to find the minimum pack capacity that delivers the target shift length at the 90th-percentile worst day of the week. On a recent 60 Ah customer project that arithmetic grew the pack to 75 Ah — and saved them from a three-month pilot failure.
3. State-of-Power (SoP) estimation — why coulomb counting fails
Coulomb counting integrates current into a “remaining capacity” number, but a robot controller needs to know what power I can pull in the next 200 ms without tripping the BMS. That is a different quantity: state-of-power. We estimate SoP from three live signals:
- DC internal resistance (DCIR) at the current SoC, measured as the 1-second terminal-voltage step under a 1C pulse. DCIR climbs sharply above 80 % SoC and below 20 % SoC for LFP cells, and climbs again when the pack is below 5 °C.
- Open-circuit voltage slope dOCV/dSoC, which for LFP is famously flat in the 30-70 % SoC band, meaning a small voltage error there maps to a large SoC error.
- Cell-surface temperature, which modulates both DCIR and OCV.
The SoP equation we ship with our packs is a discrete-time Kalman filter: a two-state estimator that fuses coulomb counting with a recursive least-squares DCIR update. In our bench tests on a 48 V / 75 Ah pack, this gives SoP estimates within ±4 % of an HPPC reference pulse across 10-90 % SoC at 25 °C, compared with ±22 % for a coulomb-only “smart battery” gauge. The robot controller uses the SoP number to derate acceleration current 100 ms before a peak event, which keeps the pack out of the BMS under-voltage trip that would otherwise abort the mission.
4. Opportunity charging — partial SoC, taper, contactor wear
Opportunity charging is the single largest source of custom battery solution performance variability. In a duty pattern where the AMR docks 18 times per shift for 90 seconds each, the pack never sees a full cycle — it lives between 40 % and 80 % SoC. Three engineering rules matter here:
- Charge acceptance at high SoC drops sharply. LFP at 80 % SoC and 25 °C accepts roughly 0.6 C before the BMS taper engages; the same cell at 95 % SoC accepts only 0.15 C. We size the charge contactor and feeder cable to deliver at least 1.0 C at the dock so the dwell window is not eaten by taper.
- High-SoC cycling is the worst regime for calendar degradation. Cycling between 60 % and 90 % SoC at 1 C gives a 5-9 % capacity loss after 1,500 cycles, while cycling 40-60 % over the same energy throughput loses 2-3 %. We work with the customer’s route planner to set the upper SoC clamp at 80 % unless a full charge is unavoidable.
- Contactor welding is the most common pack end-of-life event, not cell ageing. Mechanical docking contacts see inrush currents of 200-400 A at hot-plug. We spec AgSnO2 contact tips, a pre-charge resistor network that limits the first 80 ms to under 30 A, and a contactor-health counter that flags replacement at 50,000 cycles.
5. Fleet runtime variance — why identical packs differ 15 %
Customers always ask why two ostensibly identical AMRs finish a 9-hour shift with one at 14 % SoC and the other at 6 %. Three sources dominate, and none of them are visible on a nameplate:
- Cell-to-cell DCIR spread. Even within a single A-grade lot, DCIR can range 14-27 mΩ across 21700-format cells. After binning into three tiers at our incoming inspection we still see a 1.4-1.6× spread within a tier. That DCIR spread maps almost linearly to peak-power headroom at the same SoC.
- Payload and wheel variability. A 250 kg-rated AMR running at 312 kg loses 6-8 % energy throughput on the same route, and a worn drive wheel adds 4-7 % rolling resistance. We log payload telemetry from the lift and re-bin the duty profile weekly.
- SoP gating drift. If the BMS under-voltage gate is set to 3.0 V/cell on a pack delivered in summer and the same fleet is running in a 5 °C cold-room in winter, the available runtime drops 11-14 % purely from temperature-compensated DCIR rise. Our packs ship with cell-surface thermistor-driven gate curves, not fixed gates.
6. Acceptance testing — proving performance, not capacity
A custom battery solution for robotics should leave our facility with a duty-cycle acceptance certificate, not a capacity certificate. Our standard DVP&R runs five blocks:
- Duty-cycle runtime test — replicate the customer’s measured profile for 3 consecutive shifts on a thermal chamber at 25 °C and again at 5 °C; pass criteria is ≥ target runtime on every shift.
- SoP accuracy test — drive the pack through an HPPC reference matrix (0.5 C pulses at 10, 30, 50, 70, 90 % SoC) and compare live SoP to reference within ±5 %.
- Opportunity-charge throughput test — 1,000 simulated dock cycles at the customer’s contactor dwell profile; pass criteria is no contactor welding and < 3 % capacity loss.
- Fleet variance test — bench 6 packs through the same duty profile; report runtime spread as a percentile envelope, with a pass gate at < 8 % spread.
- Standards compliance — UN 38.3 transport, IEC 62133-2 safety, IEC 62619 industrial Li-ion, UL 2271 light-EV/mobility, and where applicable ISO 3691-4 for driverless industrial trucks.
7. Cold-room and refrigerated AMR performance
Cold-room deployments (–5 to –25 °C) compress every performance number we have discussed so far. At –20 °C cell DCIR roughly triples, opportunity-charge acceptance collapses, and the BMS gate must be temperature-compensated or the pack will trip on the first acceleration peak. We use two strategies: a self-heating BMS that pulses current through the cells at low duty to raise internal temperature above 0 °C before drive enable, and a heated charge dock that pre-warms the contactor surface. In a recent cold-room pharmaceutical pilot, the self-heating strategy added 6 W average and recovered 18 % of the lost runtime.
8. Standards and compliance anchor
Every battery solution we ship for robotics is documented against the relevant international standards so that the customer’s CE / UL / UN paperwork closes cleanly:
- UN 38.3 — transport classification for lithium cells and packs.
- IEC 62133-2 — safety requirements for portable lithium cells.
- IEC 62619 — secondary lithium cells for industrial applications (covers most robotic packs).
- UL 2271 — light electric-vehicle battery standard, used for mobile AMR / AGV platforms.
- ISO 3691-4 — safety of driverless industrial trucks, the parent standard that references the battery system requirements.
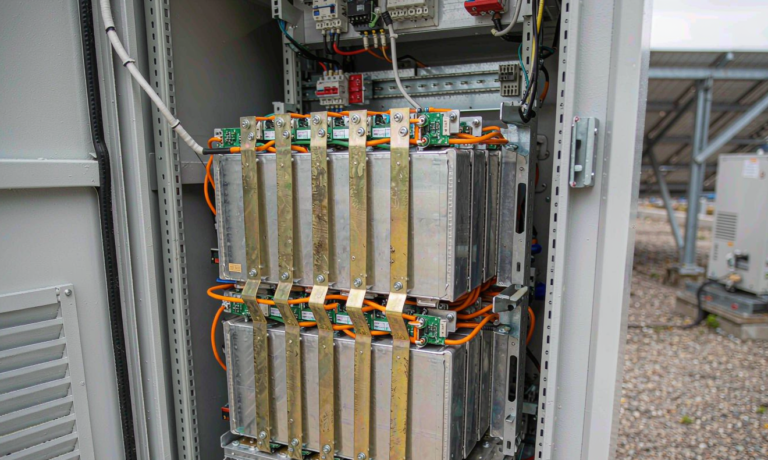
- UL 9540 / UL 9540A — if the robot shares a charging enclosure with multiple packs.
FAQ
How is “battery solution performance” different from “battery capacity”?
Capacity is the energy stored in the pack (Wh or Ah). Performance is the rate at which that energy can be safely delivered and re-absorbed under the robot’s actual duty cycle, at its actual operating temperature, with the actual state-of-charge headroom it sees. Two packs with identical nameplate capacity can differ 25 % in shift runtime depending on how their peak power, regen absorption, and opportunity-charge throughput are engineered.
Why does my fleet show 15 % runtime variance across identical packs?
Three sources dominate: cell-to-cell DCIR spread (1.4-1.6× within an A-grade bin), payload and wheel-condition variability across the fleet, and temperature-compensated BMS gate drift between hot and cold shifts. We address all three with tighter incoming cell binning, payload-aware duty profiling, and thermistor-driven gate curves rather than fixed gates.
What is state-of-power (SoP) and why does it matter for robots?
SoP is the maximum power the pack can deliver for the next 200 ms without tripping BMS limits. Coulombs only tell you the remaining energy; SoP tells the robot controller how hard it can accelerate, lift, or absorb regen without aborting the mission. A Kalman-filter SoP estimator typically gives ±4 % accuracy versus ±22 % for a coulomb-only gauge.
How often can a robot opportunity-charge without killing the pack?
LFP chemistry tolerates partial cycles well — cycling between 40-80 % SoC at 1 C gives only 2-3 % capacity loss per 1,500 cycles, compared with 5-9 % when cycling 60-90 % SoC. The real wear item is the docking contactor, which we spec to 50,000 mechanical cycles with a pre-charge resistor to limit hot-plug inrush.
Does cold-room operation change the performance spec?
Substantially. At –20 °C, LFP DCIR roughly triples, opportunity-charge acceptance collapses, and the BMS under-voltage gate must be temperature-compensated. We use a self-heating BMS or a heated charge dock to recover 15-20 % of the lost cold-room performance, and we re-run the acceptance duty-cycle test at 5 °C as a release gate.
Which standards apply to a robotic battery solution?
For most AMRs and AGVs the bundle is UN 38.3 for transport, IEC 62619 for industrial Li-ion, IEC 62133-2 for cell-level safety, UL 2271 for light-EV/mobility platforms, and ISO 3691-4 for the driverless-truck parent standard. If multiple packs share an enclosure, UL 9540A for thermal-runaway propagation is also part of the conversation.