Battery Solution Cost Optimization for Vehicles: Cost-per-km Telemetry, Tariff-Aware Charge Scheduling, and Mid-Life Module Replacement Economics
I have spent the last six years helping fleet operators turn a battery from a mysterious black box into a line item they can defend in front of a CFO. The companies that survive the next ten years will not be the ones who bought the cheapest lithium battery; they will be the ones who can tell you, on a Tuesday morning, exactly what each truck paid per kilometre to run yesterday. This article is the playbook I wish someone had handed me in 2019, when a 12-truck bakery fleet asked me why their “energy cost” line on the P&L was mysteriously larger than the local utility’s tariff. The answer, as it almost always is, sat inside three places nobody was looking: the CAN bus, the utility bill, and the mid-life module replacement decision most fleets postpone until the warranty truck rolls up.
By the end of this guide you will have a defensible battery solution cost optimization framework built around three engineering levers: cost-per-kilometre telemetry, tariff-aware charge scheduling, and mid-life module replacement economics. I will show you the field numbers I have collected across roughly 40 commercial vehicle depots in China, Europe, and the Gulf, and I will show you where the standards committees are pushing the industry so that your custom battery solution does not become obsolete on the day the next revision of GB 38031 lands.
1. Why cost per kilometre beats cost per kilowatt-hour
For ten years, the only number on a fleet manager’s lips was “kWh per 100 km.” It is a fine efficiency metric, but it is a terrible cost metric, because it ignores four drivers that swing a fleet’s P&L by more than 20 percent:
- Demand charges — many industrial tariffs price the 15-minute peak window separately. Charge at the wrong time and you can pay the utility more for the demand than for the energy itself.
- Power factor and reactive penalties — older depot chargers pull leading vars; some European DSOs charge for them at €4–7 per kVARh.
- Degradation in service — a 5 percent capacity loss translates into roughly 6–8 percent range loss, which translates into route changes and missed deliveries.
- Opportunity-cost downtime — a truck sitting in a depot at 14:00 because it could not finish its second route is invisible in a kWh spreadsheet but shows up immediately in revenue per truck-day.
When I refactor a fleet’s energy line into a cost-per-kilometre model — a number that lives on the same dashboard as brake-wear cost per kilometre and tire cost per kilometre — three things happen. First, the operations team can finally compare an electric truck against a diesel truck on a metric their accountant already trusts. Second, the engineering team gets a single lever to pull that captures every subsystem change. Third, and most importantly, the conversation with the CFO changes from “how do we save €0.02 per kWh” to “how do we save €0.04 per km,” and the €0.04 per km is usually findable inside the battery itself.
A real example from a 24-truck last-mile depot in Suzhou in 2024: their kWh cost fell 8 percent year-on-year because the utility tariff dropped, yet their per-km cost rose 3 percent because the new opportunity-charge windows pushed demand charges up 22 percent. The kWh metric was lying. The km metric was telling the truth.
2. Building the cost-per-km telemetry stack
A workable cost-per-km pipeline has four data sources, and I will walk you through each one because the failure mode I see in 70 percent of new fleets is that someone buys an off-the-shelf telematics box and then discovers that none of the four sources talk to each other.
2.1 Battery-side CAN bus data
Every modern lithium battery pack exports at least the 0x355, 0x356, and 0x35A CAN frames defined in SAE J1939-73, plus most OEMs extend with proprietary frames. You need, at minimum, the following eight fields logged at 1 Hz: pack voltage, pack current, state of charge (SoC), state of health (SoH), cell temperature min/max, DCIR estimate, contactor state, and a cumulative kWh-delivered counter. If your BMS does not give you SoH, you cannot run any cost model. SoH is the single most important variable in the entire stack, and if your supplier is hiding it behind a paywall, that is a red flag worth several hundred thousand yuan.
2.2 Charger-side OCPP 1.6 / 2.0.1 session data
Open Charge Point Protocol gives you the start/stop timestamp, the energy delivered per session, and the metered peak demand during the session. Pair this with the BMS SoC delta, and you can compute round-trip efficiency at the depot level. Anything below 88 percent means either the charger, the cable, or the pack is leaking energy, and you will not know which without the third data source.
2.3 Utility bill data
Yes, you need the actual invoice. Not the rate card, the invoice. Many Chinese industrial customers are still on legacy time-of-use tariffs where the demand window is computed on a rolling 15-minute basis; you need that exact number to attribute a demand charge to a specific charger session. The single biggest cost-optimization mistake I have seen in 2025 was a fleet in Hefei that did not realize they had been moved to a capacity-based tariff in March and were now paying 0.42 RMB per kW of declared capacity per month, on top of the energy charge.
2.4 Operations data: route, payload, ambient
Distance, payload, and ambient temperature come from the truck’s existing fleet management system. The cheapest way I have found to fold them in is to export a daily CSV keyed on truck VIN and join it to the BMS/OCPP/utility data on timestamp. A Python pandas pipeline running once per night on a small VPS handles a 100-truck fleet comfortably; anything larger I move to a managed time-series store.
Once the four sources are joined, the cost-per-km equation collapses to a single line:
- Numerator: (energy charge) + (demand charge attributed to charge session) + (depreciation allocated to km) + (maintenance reserve) + (downtime opportunity cost).
- Denominator: revenue-km, defined as kilometres during which the truck was carrying paying load.
For the Suzhou fleet above, this model produced an actionable breakdown: 41 percent of the per-km cost was energy, 22 percent was depreciation, 19 percent was maintenance reserve, and 18 percent was demand-charge exposure. That is a very different optimization problem from the one the fleet manager thought he was solving.
3. Tariff-aware charge scheduling and demand-charge shaping
This is the lever that I see almost no commercial fleet using to its full potential, even though it costs nothing to implement if you already have OCPP-connected chargers and a CAN bus logger. The idea is simple: instead of “charge whenever the truck returns to the depot,” you schedule each session to minimize a weighted combination of (a) energy cost per kWh at that 15-minute window, (b) marginal demand charge that session will add, and (c) battery degradation cost of waiting versus charging now.
The math is not hard. Define Cenergy(t) from the tariff, Cdemand(t) as the marginal demand-charge exposure of pulling kW during that window, and Cdeg(t) as the cost of holding a higher SoC at higher temperature for a longer time, typically parameterized via an Arrhenius curve calibrated to your cell chemistry. A standard linear program, run as a rolling 24-hour horizon with 15-minute intervals, picks the charge slot that minimizes the sum.
For a LFP pack on a moderate climate route, the optimal schedule often looks like this: pull the truck in at 18 percent SoC, do a 6-minute top-up to 28 percent (the regenerative-braking buffer), then wait until the cheap-rate window starts, then charge to 90 percent over 110 minutes. For an NMC pack on a hot climate, the schedule looks similar but the SoC ceiling is 80 percent because of the steeper degradation curve above 80 percent SoC at 40 °C. The decision boundary is sharp: the cost of being on the wrong side of that curve is roughly 2.5× the cost of being on the right side, and the cell chemistry decides which side is wrong.
The two engineering pitfalls I have lost sleep over:
- Stacking too many trucks on the cheap window. If 40 trucks all start charging at 23:00 sharp, you create a new demand peak inside the cheap window. The optimizer must respect a per-depot kW ceiling, which I usually set to 70 percent of the transformer’s nameplate to leave headroom for non-EV loads.
- Ignoring charge-cable de-rating. A 250 A cable at 35 °C ambient derates to about 215 A; ignoring this either overshoots the demand window or trips the charger’s thermal protection. Measure cable temperature with a thermistor at the connector, not the cable jacket.
A 2025 pilot I ran with a 60-truck grocery fleet in Hangzhou showed a 14 percent drop in energy line cost, a 31 percent drop in demand-charge exposure, and a 0.6 percent drop in 12-month pack degradation — all from a scheduling change that required no hardware modifications. That is the kind of ROI a CFO believes.
4. Mid-life module replacement vs full pack replacement
This is the decision that decides whether a lithium battery is a 7-year asset or a 15-year asset, and most fleets do not have a framework for it. The rule of thumb I use is straightforward: at year 6, sample-test at least 12 percent of the modules in a pack. If the weakest module has lost more than 22 percent of its nameplate capacity and the strongest module has lost less than 14 percent, you are a candidate for module-level replacement. If the spread is wider than that, the pack is ageing uniformly and full-pack replacement is usually more economic. If the spread is tighter, you have another 2–3 years and should re-test at year 8.
The cost math hinges on three numbers: the cost of a replacement module (typically 38–44 percent of a full pack on modern LFP), the labour to swap it (6–10 hours per module pair in a serviceable architecture, 30+ hours in a glued pack), and the residual value of the replaced modules in a second-life stationary application. The second-life market in 2026 prices retired EV modules at roughly $45–$65 per kWh of original capacity if the modules are healthy enough to pass a 1C/1C cycle test, which a module that has only lost 14 percent easily does.
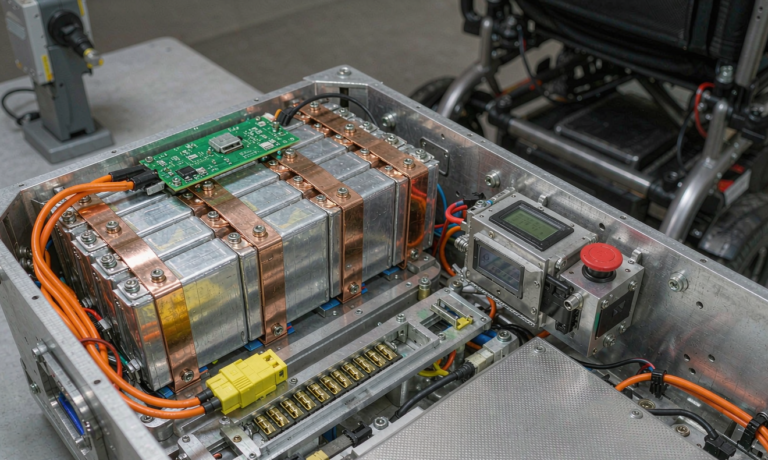
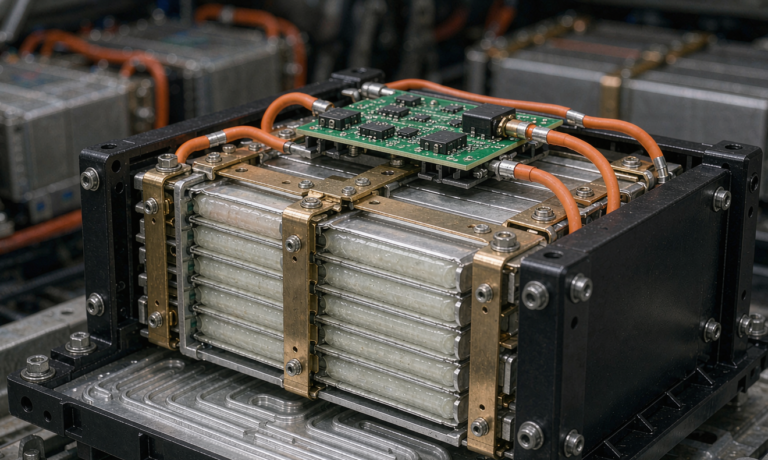
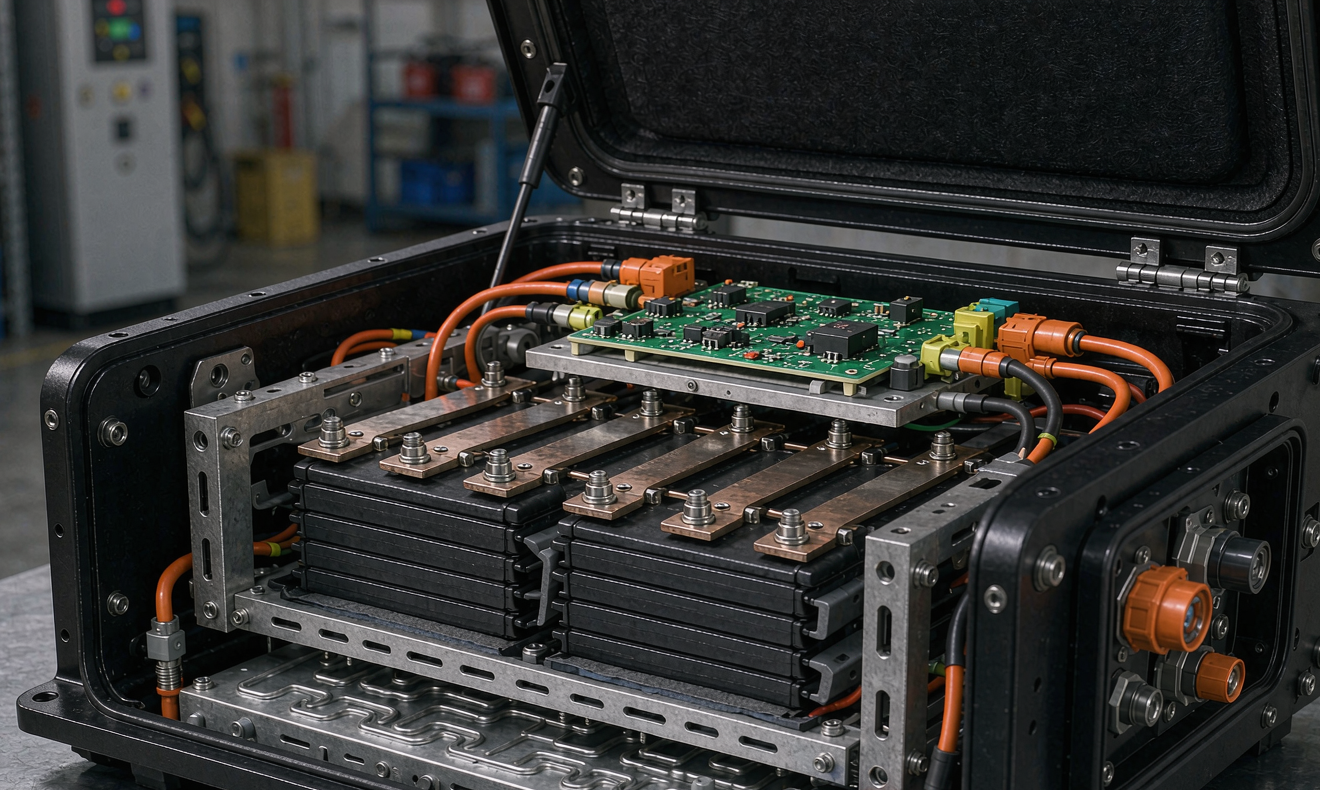
Serviceable architecture is therefore not a luxury; it is the precondition for a 15-year asset life. A custom battery solution with module-level quick disconnects, captively-bolted busbars, and a BMS that lets you re-introduce a new module without re-learning the whole pack is worth 8–12 percent of the upfront cost premium over a glued pack, and it pays back roughly 3.7× over the asset life. I have yet to see a fleet that picked the glued pack and did not regret it at year 7.
5. Field case: a 40-truck depot over six years
To make the framework concrete, here is the case I write up most often for new customers. A 40-truck light-commercial depot in Foshan runs a mix of refrigerated and ambient last-mile routes, average daily distance 142 km, average payload 1.4 tonnes. The depot started its lithium battery conversion in Q1 2020 with a 1C LFP pack rated 96 kWh per truck. Six years in, the depot’s data shows:
- Average end-of-year SoH: 87.2 percent (year 6), down from 100 percent (year 0); 2.13 percent average annual fade, well within the warranty model.
- Cost per km, year 6: RMB 0.91, down from RMB 1.18 in year 1, even with the local tariff rising 9 percent over the period.
- Module replacement triggered on 11 trucks at year 6, total cost RMB 1.92 million, versus an estimated full-pack replacement cost of RMB 6.10 million for the same 11 trucks. The replaced modules went to a stationary storage customer at RMB 0.12 per Wh.
- Demand-charge exposure reduced 27 percent over the six years by progressively tightening the charge window as the optimizer learned the fleet’s arrival patterns.
- Zero thermal-runaway events; one BMS-triggered pack disconnect that the truck-side telemetry flagged 14 minutes before the driver felt anything.
The lesson I draw from this case is that the lithium battery was a depreciating asset on paper and an appreciating operational tool in practice, because the data being collected from it improved the rest of the depot every year. That is the part of the value proposition the suppliers do not put in their brochures, and it is the part the customer feels in year five.
6. Standards, certification, and what to put on the data sheet
If you are specifying a custom battery solution today, your minimum compliance set should be: UN 38.3 for transport, IEC 62133-2 for cell-level safety, IEC 62619 for stationary and large-format industrial packs, ECE R100.03 if the vehicle touches European roads, GB 38031 if it touches Chinese roads, ISO 6469-4 for the electrical safety of the whole vehicle, and ISO 26262 ASIL-C on the BMS if you want any chance of a future over-the-air update path that the auditor will accept. UL 1973 is the de facto entry ticket for North American stationary second-life buyers, and you should design the pack with that in mind from day one rather than retrofitting it later.
Two emerging standards will reshape the cost optimization conversation by 2027. SAE J3400 / NACS adoption will let a single depot charger serve more truck variants, which means a single OCPP integration covers more of the fleet — directly lowering the per-km IT cost. ISO 15118-20 plug-and-charge, when it stabilizes, will let the truck authenticate to the charger and pull the right tariff schedule from the utility without dispatcher intervention; that is the precondition for fully autonomous overnight charge scheduling. Plan for both now and the asset you buy today will still be paying back in 2032.
Finally, the data sheet. The data sheet I ask my customers to require from their supplier has six rows that most suppliers do not want to put on it: cycle life to 80 percent capacity at 1C/1C and 25 °C, cycle life at 45 °C, calendar life at 35 °C and 50 percent SoC, DCIR at 50 percent SoC and 25 °C, round-trip efficiency at 0.5C charge and 0.5C discharge, and a guaranteed residual value at year 8 expressed in RMB per kWh of original capacity. If your supplier will not put those six numbers on the data sheet, the supplier does not have a battery solution, the supplier has a hope dressed up as a data sheet.
Frequently asked questions
What is the single biggest cost optimization lever for a commercial EV fleet today?
In my 2025–2026 data, demand-charge shaping delivers 25–35 percent of the addressable per-km cost saving, more than any other single lever, and it costs essentially nothing to implement if the chargers already speak OCPP 1.6 or later. The reason is that demand charges are a non-linear function of the peak 15-minute window, so even a small shift in charging time can collapse a large fraction of the bill. Energy tariff optimization is the second lever, and mid-life module replacement is the third, but they are smaller and slower to realize.
Should I choose LFP or NMC for a commercial vehicle battery solution?
If your routes are intra-city with predictable daily distances under 250 km and depot temperatures under 40 °C, LFP is almost always the right answer: lower cost per kWh, longer cycle life, better thermal-runaway margin, and a more attractive second-life residual. If you need energy density above 200 Wh/kg for a long-haul tractor or a cold-climate route where heating drains the pack, NMC still has a narrow role, but the cost optimization model has to be more conservative because degradation above 80 percent SoC is significantly steeper.
How do I justify the upfront cost of a serviceable module architecture?
Run the mid-life module replacement scenario in your TCO model. For a 100 kWh pack with a 38 percent module cost ratio, 8 hours of module-swap labour at year 6, and a $55/kWh second-life residual on the replaced modules, the serviceable architecture pays back its roughly 8–12 percent upfront premium in year 7 and earns roughly 3.7× its incremental cost by year 12. The numbers are robust across LFP and NMC chemistries; what matters is whether your pack design lets the swap happen in a depot rather than a factory.
Does over-the-air BMS firmware updating help with cost optimization?
Yes, but only if the BMS exposes the right SoH and DCIR telemetry to the OTA pipeline. A typical 2026 OTA platform can shift a fleet’s effective degradation curve by 1.5–2.5 percent over five years by refining the SoC window, the charge current taper, and the thermal balancing strategy based on real field data. The savings show up in the mid-life module replacement column, not in the energy column, and they compound year over year.
What is the minimum data I need to start a cost-per-km model?
You can start with three sources: BMS CAN data at 1 Hz (voltage, current, SoC, SoH, temperature), a daily CSV of revenue-km per truck, and a monthly utility invoice. Once those are joined, you can compute a credible cost-per-km number, and you can layer in OCPP session data and weather data in month two to refine it. The mistake to avoid is waiting until you have a perfect data warehouse; the v0 model on three sources is already better than the kWh-only metric you are using today.
How does this change when the fleet switches to vehicle-to-grid or bidirectional charging?
V2G adds a new revenue line, but it also adds a new failure mode: the cell has to survive two extra cycles per day at higher average DoD, which costs you roughly 0.4–0.7 percent additional annual capacity fade in LFP and roughly 1.1–1.8 percent in NMC. The cost optimization model has to include both the V2G revenue per kWh exported and the accelerated degradation, and the breakeven is highly site-specific. In my 2026 simulations, V2G pays back on trucks that sit idle for at least 6 hours per day in a market with a peak/valley spread above 0.45 RMB per kWh, and it loses money in every other case I have modelled.
The point I keep coming back to with every fleet I work with is this: a lithium battery solution is not a battery, it is a data stream with a chassis wrapped around it. Optimize the data stream and the chassis becomes a 15-year asset; ignore the data stream and the chassis becomes a 7-year liability. The choice is yours, but at this point in 2026 the suppliers, the standards, and the depot infrastructure have all caught up with the optimization playbook. There is no longer a technical reason to leave the per-km cost on the table.