Semi-Solid State Battery Peak Power for Performance EVs
In eleven years of specifying lithium battery packs for vehicle programmes, the performance-car brief is still the one that surprises people. Nobody asks me about range. The first question is always how many seconds of full power the pack can deliver before it says no, and the second is how fast it recovers. That is a completely different engineering problem from the mass-market EV work most semi-solid state battery roadmaps are written for, and it is why a cell that looks excellent on a 300 Wh/kg datasheet can be the wrong choice for a car that spends its life between 4,000 and 8,000 rpm.
Peak Power Is Not Energy Divided by Time
Energy and power are set by different physical choices inside the cell, and they trade against each other. An energy cell typically runs an areal loading of 20 to 25 mg/cm2 with 30 to 35 percent porosity and a thick, tightly calendered coating. A power-oriented cell drops that to 8 to 12 mg/cm2, opens the porosity to 40 to 45 percent, and uses thinner coatings with more conductive additive. The result is a shorter diffusion path and a lower cell DCIR, paid for with volumetric and gravimetric energy density.
The numbers matter when you size a pack. A modern energy cell in the 75 to 80 Ah class sits around 0.45 milliohm DCIR at 25 degrees Celsius and 50 percent SoC. A power cell in the 28 to 32 Ah class lands near 0.28 to 0.35 milliohm. Run both at 8C and the difference is stark: the energy cell sees 624 A and dissipates about 175 W inside the cell, while the power cell sees 240 A and dissipates roughly 20 W. Normalised per watt-hour of stored energy, that is about 0.6 W/Wh against 0.16 W/Wh, a factor close to four in self-heating at the same C-rate.
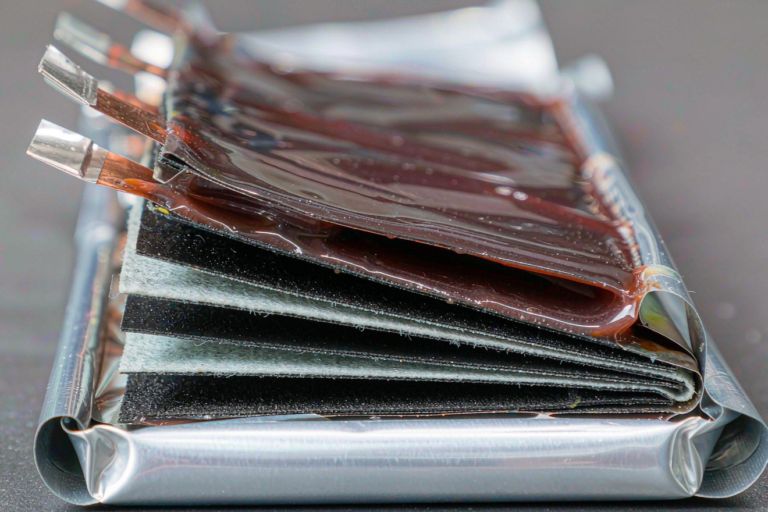
Where does semi-solid fit? The quasi-solid electrolyte layer reduces free liquid in the cell, allows higher electrode compaction under stack pressure, and gives a more uniform current distribution across the interface. In my testing the gain shows up less as a headline peak number and more as DCIR stability over life. A conventional lithium battery cell might grow 25 to 35 percent in DCIR after 500 high-rate cycles. A well-built semi-solid cell in the same duty holds that growth closer to 12 to 18 percent, which is what keeps your year-three lap time close to your year-one lap time.
The Duty Cycle Nobody Puts on the Spec Sheet
Suppliers quote peak power as a 10 or 30 second pulse from a rested cell at 25 degrees Celsius. A performance car never sees that. Take a representative 4.0 km circuit with a 100 second lap and 55 percent full-throttle distance. Electrical power at the pack terminals averages about 200 kW and peaks near 450 kW, with eight to twelve braking zones returning 60 to 350 kW.
Do the arithmetic per lap. One hundred seconds at an average of 200 kW is 5.6 kWh drawn. Regeneration returns roughly 1.3 kWh of that, so the net draw is about 4.3 kWh per lap. A twenty minute stint of twelve laps therefore needs about 51 kWh of usable energy, and if you hold a 20 percent reserve for the cool-down lap and the pit lane, the nameplate capacity lands near 68 kWh. That is the number that surprises programme managers who started from a 400 km range target and assumed it would carry over.
The harder part is the current profile. Peak is brief, two to five seconds, but sustained discharge between braking zones runs at two to three times the average. Sizing the pack on average power gives you a car that is quick for one lap and then walks away from you.
Voltage Sag and Thermal Soak: The Two Walls
Voltage sag is instantaneous
Consider an 800 V nominal pack built from 216 cells in series. Cell DCIR of 0.35 milliohm gives 75.6 milliohm at the cell stack; add busbars, joints, contactors and fuses and you are near 90 milliohm end to end. At a 560 A peak the drop is about 50 V, or 6.3 percent of nominal. The inverter DC bus sees 750 V instead of 800 V, which the motor controller must cover with higher current for the same shaft power, which raises losses again. Sag is why the last ten percent of SoC feels worse than a simple energy calculation predicts.
Thermal soak is cumulative
At that same 560 A the resistive heat is roughly 28 kW. Averaged over a lap at 45 percent full throttle it is closer to 9 kW. A cold plate with 30 degrees Celsius inlet at 12 litres per minute and a 5 K coolant rise removes about 4.2 kW, leaving roughly 4.8 kW going into the pack. Over 1,200 seconds that is 5.8 MJ. With a 380 kg pack at roughly 1,000 J/kgK, the bulk temperature climbs about 15 K across the stint, taking cells from a 35 degrees Celsius start to around 50 to 55 degrees Celsius. Semi-solid cells tolerate the top of that range better than liquid-electrolyte cells, but the BMS will still start trimming state-of-power long before anything is damaged.
Regen Acceptance Near Full Charge Is Where Packs Embarrass Themselves
The failure I see most often in performance programmes has nothing to do with discharge. It is a 350 kW regen pulse arriving into a pack at 93 percent SoC and 28 degrees Celsius. At 800 V that is 437 A of charge current, and the anode potential is already close to the lithium plating threshold. Push it and you plate metallic lithium on the anode surface, permanently consuming inventory and raising DCIR. You feel it two sessions later as a pack that sags earlier than it used to.
The fix is a regen acceptance map as a function of SoC and cell temperature, and it belongs in the BMS calibration on day one, not in a software update after the first damaged pack. A map I have used successfully allows full 350 kW regen below 80 percent SoC at 40 degrees Celsius, tapers to 150 kW at 90 percent, and to 50 kW above 95 percent, with a further halving below 25 degrees Celsius. The quasi-solid interlayer in a semi-solid cell makes the plating front more uniform and slows its growth, which buys roughly five to ten percent more regen headroom. It does not remove the thermodynamic limit, and any supplier who tells you otherwise has not run the teardowns.
Cooling Architecture Sets Continuous Power, Cells Set Peak Power
These are two different limits and conflating them is the most common sizing error I review. Peak power for a ten second window is set by the cell: its DCIR, its diffusion capability and the voltage floor your inverter tolerates. Continuous power is set almost entirely by how fast you can move heat out of the pack.
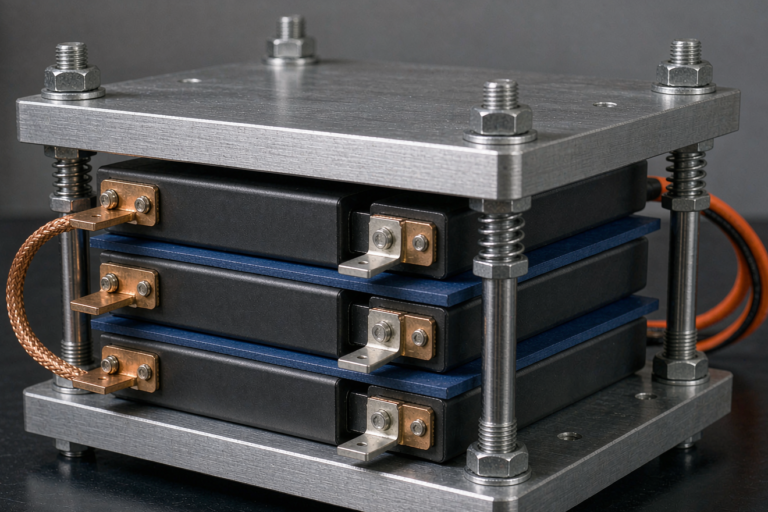
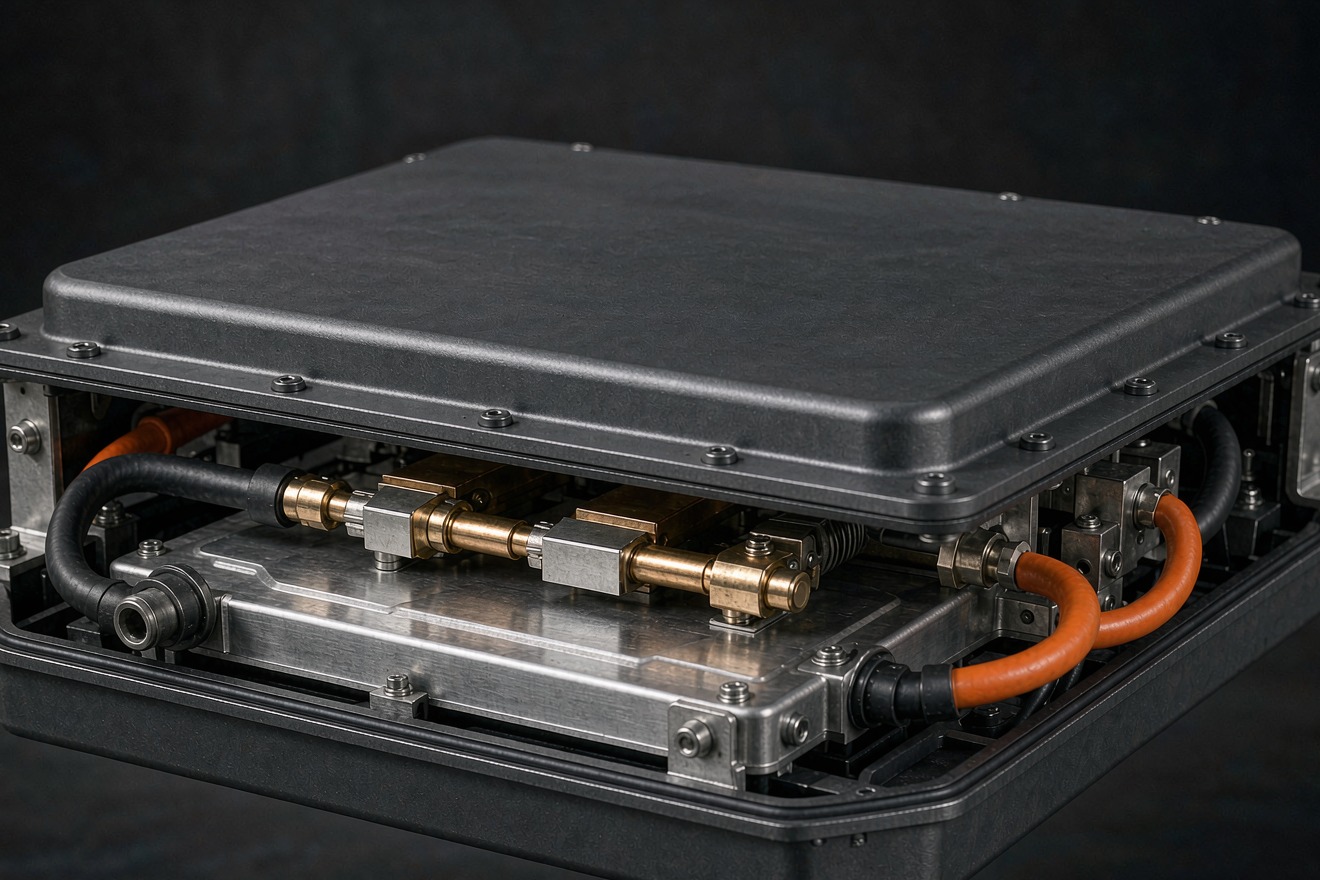
Express it as thermal resistance in K/kW. A conventional cold plate under a prismatic module, with a 1.0 mm gap-filler bond line at 2.5 W/mK, typically lands the pack at 2.5 to 3.5 K/kW. Direct dielectric cooling, where a fluorinated fluid flows across the cell surfaces, cuts that to roughly 1.0 to 1.5 K/kW because you delete the gap filler, the module baseplate and the thermal pad stack. With a 25 K allowable rise over a 30 degrees Celsius inlet, that is the difference between sustaining about 8 kW of continuous heat rejection and sustaining about 20 kW, which is a 2.5x difference in the sustained power you can advertise.
For a car that does back-to-back sessions, that gap matters far more than any cell chemistry choice. I would take a slightly lower specific power cell with direct cooling over a higher power cell on a cold plate every time.
The Bench Test I Run Before a Performance Pack Ships
Supplier datasheets are measured on a rested cell in a 25 degrees Celsius chamber. Before I release a design to a customer, I run a lap-simulated profile on a 1,000 V cycler with the pack in a thermal chamber and the customer’s real coolant loop attached. The profile is a 10 Hz current trace built from telemetry, or from a synthetic lap model when telemetry is not available, and it includes the braking pulses rather than smoothing them into a net figure.
I run a three by three matrix: coolant inlet at 25, 35 and 45 degrees Celsius, starting SoC at 90, 70 and 50 percent, twelve laps each. Acceptance criteria are specific. State-of-power floor after twelve laps must stay above 70 percent of nominal peak. Maximum cell temperature must stay under 60 degrees Celsius. Cell-to-cell spread must stay within 6 K. No cell may drop below 2.8 V under a peak pulse at 20 percent SoC. And after fifty session-equivalent cycles, DCIR growth must stay under 8 percent at beginning-of-life temperature.
Which standards actually apply
One thing worth stating plainly: IEC 62133, which many buyers reflexively ask for, covers portable sealed cells and does not apply to traction packs. The applicable set is IEC 62660-1 for cell performance testing, IEC 62660-2 for reliability and abuse, ISO 12405-4 for pack-level power and energy determination, UN ECE R100.02 for vehicle-level electrical safety, GB 38031 for the Chinese market, and UN 38.3 plus the IATA packing instructions for getting the pack to the circuit in the first place.
Spec Sheet Lines to Demand From Your Cell Supplier
When you write the RFQ, ask for these as separate line items rather than a single figure: peak and continuous specific power in W/kg at a stated SoC and cell temperature; DCIR at beginning of life and after 500 cycles at 45 degrees Celsius; the full regen acceptance curve against SoC and temperature; the state-of-power derating map; and the cell-to-cell thermal spread at the end of a defined duty cycle. Semi-solid state battery peak power claims are only meaningful when they arrive with the duty cycle they were measured on.
At Horizon Power this is the point where a custom battery solution stops being a marketing phrase and becomes engineering work: we build the lap profile with the customer, run the matrix, and hand over the derating map and the acceptance data with the pack. It is the same discipline my colleagues apply to a drone battery pack that has to survive a 5C takeoff pulse at 45 degrees Celsius ambient, and it is the only way I know to keep a peak power number honest.
Frequently Asked Questions
Does a semi-solid state battery really deliver more peak power than a conventional lithium battery?
Per kilogram at beginning of life, the difference is smaller than the marketing suggests, typically 10 to 20 percent for a comparable power-oriented design. The real advantage shows up after cycling, because the quasi-solid interface holds DCIR growth to roughly half what a liquid-electrolyte cell shows in the same high-rate duty. Ask for end-of-life DCIR, not beginning-of-life peak watts.
Why does my pack lose power after three laps when the gauge still shows 60 percent?
Because you have hit the thermal wall, not the energy wall. Cell temperature has climbed 15 to 25 K, the BMS has trimmed the state-of-power limit to protect the cells, and the driver feels it as a soft pedal. A pack with twice the usable energy but the same cooling will behave almost identically.
How much peak power do I actually need for a track-day car?
Size from the duty cycle, not from the motor rating. On a 4 km circuit with 55 percent full throttle, average pack power runs about 200 kW with 450 kW peaks, and a twelve-lap stint needs roughly 51 kWh usable. Cooling capacity then decides whether that peak is available on lap twelve or only on lap one.
Can I fast-charge a semi-solid performance pack between sessions?
Yes, within limits. Charge acceptance above 80 percent SoC falls away quickly, so the practical pattern is a shallow charge from 30 to 75 percent at 2 to 3C rather than a deep charge to 100 percent. Deeper charging also puts you back into the regen plating window on the first braking zone of the next session.
What cell temperature limit should I design to?
I hold 55 degrees Celsius as the continuous ceiling and 60 degrees Celsius as the absolute trip, with no more than 6 K spread across the pack at end of stint. Semi-solid cells tolerate the upper end better than liquid cells, but calendar ageing above 50 degrees Celsius still roughly doubles for every 10 K.
How do I validate a peak power claim before placing a production order?
Ask for a lap-simulated 10 Hz current profile run at three coolant inlet temperatures and three starting SoC points, with the acceptance criteria written into the contract: state-of-power floor above 70 percent of nominal after the stint, maximum cell under 60 degrees Celsius, and DCIR growth under 8 percent after fifty session-equivalent cycles.
Further Reading
References