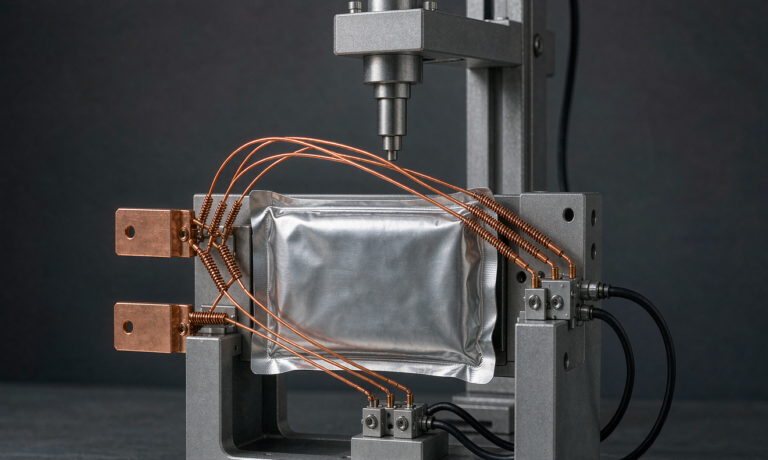
Semi-Solid State Battery SOH Estimation Methods
As a senior lithium battery engineer who has spent the last decade qualifying cells for demanding commercial programs, I get asked one question more than any other about semi-solid state packs: how do you actually know how healthy they are? State of Health, or SOH, is the single number that decides whether a pack stays in service, moves to a second-life program, or gets retired. For semi-solid state battery SOH estimation, the job is harder and more interesting than it is for conventional lithium ion cells, because the composite electrolyte changes the way capacity fades and resistance grows. This article walks through the methods my team uses to put a trustworthy SOH number on every semi-solid pack we ship and service.
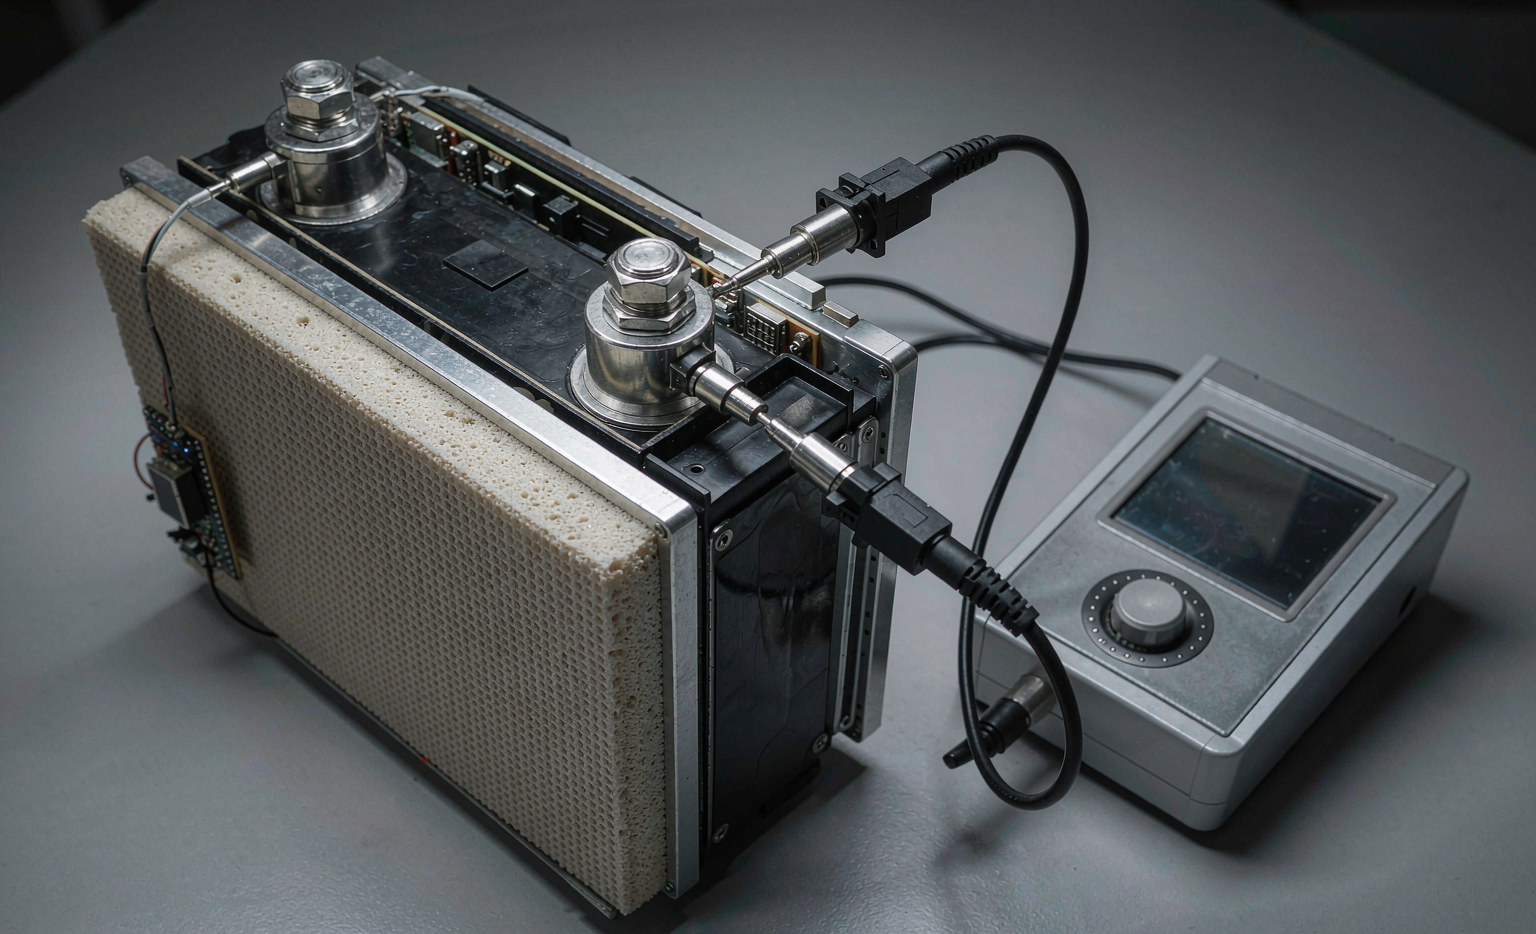
What SOH Means for Semi-Solid State Cells
State of Health is the ratio of a cell’s current maximum usable capacity to its rated capacity at birth, expressed as a percentage. A fresh pack sits at 100 percent. Most warranty and second-life programs draw the retirement line at 80 percent SOH, because that is where usable capacity and peak power start to fall outside the original specification window.
For semi-solid state batteries, the rated capacity number carries extra weight because these cells push energy density to 300 to 360 Wh/kg, well above the 250 to 280 Wh/kg typical of good lithium ion cells. That extra headroom means a semi-solid pack can absorb more absolute fade before it crosses the 80 percent line, but it also means the estimation method has to be accurate enough to trust the number. A method that is off by 5 percent is acceptable for a cell graded at 95 percent; the same error is dangerous when the true value is near 81 percent and the decision is retire or keep.
SOH also drives the commercial conversation. When a procurement engineer compares a semi-solid quote against a lithium ion quote, the usable-life number behind the warranty is the real differentiator, not the headline Wh/kg. A pack that holds 90 percent SOH for 1,200 cycles is worth more than a pack that reaches 80 percent at 800 cycles, even if both start at the same capacity. Estimating SOH well is therefore both a safety control and a purchasing tool, and I treat it as a first-class spec rather than a maintenance afterthought.
Why the Composite Electrolyte Changes the SOH Picture
Semi-solid state cells use a composite cathode soaked in a quasi-solid or gel electrolyte, with a small amount of ionic liquid bridging the interface. This design cuts interfacial resistance versus full solid-state cells and improves rate performance, but it introduces fade paths that pure liquid electrolyte cells do not show as strongly.
The three dominant fade mechanisms I see in lab and field data are active lithium loss at the anode, micro-cracking of the high-loading cathode particles, and gradual wetting degradation of the separator and electrolyte interface. The first two show up as capacity loss; the third shows up first as a rise in charge-transfer resistance. That is why any credible semi-solid state battery SOH estimation method has to track resistance, not just capacity. A pack can lose 10 percent of its capacity while its resistance tells a completely different story about remaining life.
Coulomb Counting and Capacity-Based Estimation
The simplest SOH method is capacity-based: fully charge, fully discharge at a fixed rate, and compare delivered capacity to rated. In the field, coulomb counting integrates current over time to estimate the available capacity without a full cycle. It is cheap and runs on existing BMS hardware, which makes it the default for most commercial fleets.
The catch is drift. In my qualification tests, a standalone coulomb counter accumulates 2 to 5 percent error over roughly 200 cycles if you never recalibrate against a reference discharge. For semi-solid packs with long design lives, that drift alone can mask a real fade event. The fix is a periodic capacity reset, where the BMS forces a controlled full cycle every 30 to 50 cycles and re-anchors the SOH baseline. Treat the counter as a good tracker, not a stand-alone truth source.
Impedance Spectroscopy for Semi-Solid Packs
Electrochemical Impedance Spectroscopy, or EIS, is the method I trust most for semi-solid state battery SOH estimation because it reads the cell’s internal resistance directly. You inject a small alternating current across a frequency sweep, typically 10 kHz down to 10 mHz, and plot the real and imaginary impedance on a Nyquist chart.
The semicircle in the mid-frequency range maps to charge-transfer resistance, Rct. In semi-solid cells, Rct is accessible and stable enough to use as an SOH proxy: a healthy pack shows Rct around 15 to 30 milliohms per cell, while a pack at 80 percent SOH commonly shows 40 to 60 milliohms. The beauty of EIS is that it needs only a short excitation, so you can run it during a normal charge without disrupting operation. The limitation is that you need a clean current source and temperature compensation, because Rct shifts about 1 percent per degree Celsius and an uncompensated reading will fake a fade that is not there.
Model-Based and Data-Driven Tracking
For fleet operators who want continuous SOH without stopping to test, model-based estimators are the practical answer. An equivalent circuit model with a Kalman filter fuses voltage, current, and temperature into a live SOH estimate. Particle filters handle the non-linear fade curves of semi-solid cells better than a plain Kalman filter, at the cost of more compute on the controller.
Data-driven methods, including incremental capacity analysis and differential voltage analysis, turn a normal charge curve into an SOH signal by watching where the capacity peaks shift. I have had good results combining a lightweight model-based filter with periodic EIS checkpoints: the model fills the gaps between tests, and the EIS keeps the model honest. This hybrid is now my default for any semi-solid program where the pack cannot be pulled for a bench test on a regular schedule.
One practical note from the field: temperature history matters as much as the algorithm. A pack that spent a summer at 45 degrees Celsius will fade faster than its cooler twin, and a model that ignores thermal history will overestimate SOH. I feed at least 90 days of temperature bin data into the filter before I trust its long-term trend, and I flag any pack whose estimated SOH diverges from its EIS checkpoint by more than 4 percent for a manual review.
Grading, Warranty and Fleet Rotation
Once you can estimate SOH reliably, the real value is in what you do with the number. I grade packs into three bands: above 90 percent for primary duty, 80 to 90 percent for reduced-duty or balanced fleets, and below 80 percent for second-life or recycling. The bands are simple, but they let a logistics manager plan replacements months ahead instead of reacting to a failure.
This is also where a custom battery solution earns its keep. A fleet running mixed semi-solid and lithium ion packs needs one SOH rule set per chemistry, because the fade slopes differ and a single threshold will either scrap good cells or keep bad ones. Tie the grading to IEC 62660-1 for capacity verification and IEC 62660-3 for performance, and keep UN38.3 documentation current so retired packs can still ship legally to a second-life site. Good SOH data is what makes the whole circular plan work.
How accurate is semi-solid state battery SOH estimation in the field?
With a hybrid model-based plus EIS approach, you can hold SOH error to about 2 to 3 percent across a pack’s life. Coulomb counting alone drifts to 5 percent or more without recalibration. The accuracy you need depends on the decision: a 3 percent error is fine for scheduling, but dangerous near the 80 percent retirement line, where I always confirm with a direct capacity or EIS test.
What SOH level should trigger retirement of a semi-solid pack?
Most programs retire at 80 percent SOH, the point where usable capacity and peak power fall outside the original specification. Some high-duty fleets set a stricter 85 percent line to protect uptime. Below 80 percent, the cell is usually routed to a second-life application with lower power needs rather than straight to recycling, which recovers more value from the materials.
Can EIS be run without taking a pack offline?
Yes. A full EIS sweep takes only seconds to a few minutes and can run during a normal charge or rest period without disrupting service. The key requirements are a clean excitation current source and temperature compensation, because charge-transfer resistance moves about 1 percent per degree Celsius. In-fleet EIS is the reason I can track SOH continuously instead of waiting for a bench appointment.
Does SOH estimation differ between semi-solid and lithium ion cells?
The math is the same, but the failure signatures differ. Semi-solid cells show earlier resistance growth from electrolyte wetting degradation and cathode micro-cracking, so a resistance-aware method like EIS matters more. Lithium ion cells fade more through SEI growth, which is easier to track with capacity methods. Running one rule set for both chemistries will mis-grade one of them, which is why I keep separate models per chemistry.
Which standards apply to semi-solid battery SOH testing?
Capacity verification follows IEC 62660-1, performance and SOH-related reliability follow IEC 62660-3, and transport of retired packs still requires UN38.3. For aviation-linked programs, FAA and EASA expectations align with those IEC baselines. I keep a test record per pack that maps directly to these standards so a customer or auditor can trace any SOH number back to a documented procedure.
Further Reading
References