Semi-Solid State Battery Internal Resistance Measurement
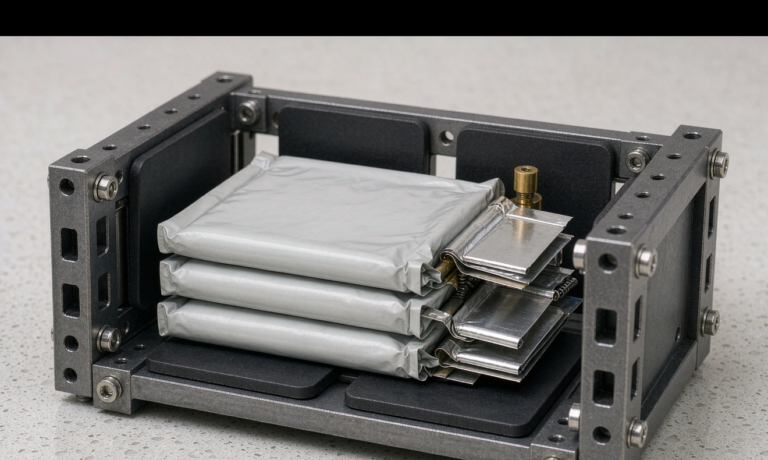
When a customer asks why their drone battery sags under a hard throttle punch, the answer is almost always internal resistance. Over my years building lithium battery and semi-solid state battery packs at Horizon Power, I have learned that DCIR is the single number that predicts whether a cell will deliver rated power or quietly strangle it. This article explains how we measure semi-solid state battery internal resistance, why the semi-solid electrolyte changes the game, and the acceptance limits we hold our production cells to.
Our internal resistance testing program now covers more than forty production cell designs, and the method below is the one we hand to new customers as part of every custom battery solution quotation.

Why Internal Resistance Defines a Semi-Solid Cell
Internal resistance is the sum of every barrier a lithium ion and its electrons must cross between one electrode and the other. In a conventional lithium battery the liquid electrolyte is thin and mobile, so the ionic path resistance is low. A semi-solid state battery replaces part of that liquid with a thicker, paste-like composite electrolyte. That improves safety and energy density, but it also adds a viscous ionic path the ion must traverse. The result is a higher baseline resistance and a stronger temperature sensitivity than a liquid cell of the same format.
For a drone battery or any high-power application, resistance translates directly into heat and voltage drop. At a 10C discharge pulse, a 30 milliohm cell loses 3 volts internally before the load even sees it. That is why we characterize resistance across the full operating window, not just at room temperature and 50 percent state of charge.
Ohmic, Charge-Transfer, and Diffusion Contributions
We break total resistance into three physical buckets. Ohmic resistance comes from the current collectors, tabs, separator, and the bulk ionic path through the semi-solid layer. Charge-transfer resistance lives at the electrode and electrolyte interface, where ions shed their solvation shell and enter the active material. Diffusion resistance, sometimes called Warburg behavior, appears when ions must migrate through concentrated regions during a sustained pulse.
In semi-solid chemistries the ohmic term dominates more than it does in liquid cells, because the composite electrolyte has lower ionic conductivity. That is the trade we watch. A well-formulated semi-solid state battery keeps the ohmic term within 15 to 25 milliohms for a typical pouch cell, while charge-transfer stays below 10 milliohms at room temperature.
DCIR Versus AC Impedance: What Each Tells You
Engineers often confuse two instruments. AC impedance, measured by electrochemical impedance spectroscopy, applies a tiny alternating current across a frequency sweep from 100 kilohertz down to 10 millihertz. It separates the ohmic, charge-transfer, and diffusion arcs on a Nyquist plot. It is diagnostic but slow, and it does not tell you how the cell behaves under a real load.
DC internal resistance, or DCIR, is the practical number. We force a known current pulse and divide the resulting voltage step by the current. DCIR captures the resistance the application actually feels. For pack design and qualification we report DCIR, and we use impedance spectroscopy only to root-cause a cell that fails the DCIR gate.
The HPPC Pulse Method We Run in the Lab
We follow a hybrid pulse power characterization routine adapted from IEC 61960-3. The cell is conditioned at a target state of charge, then we apply a 10 second discharge pulse at a defined C-rate, rest for 40 seconds, then a 10 second charge pulse of equal magnitude. DCIR equals the sum of the discharge and charge voltage steps divided by twice the pulse current, which cancels the open-circuit shift during the rest.
For a semi-solid state battery we use pulse currents that match the real application. A drone battery rated for 15C sees 15C pulses, not a gentle 1C. We log voltage at 1 millisecond resolution so the initial ohmic jump is not smoothed away by cycler averaging.
We repeat the pulse at every 10 percent SOC step from 90 percent down to 10 percent, allowing a 30 minute rest between steps so thermal and concentration effects relax. A full DCIR map takes about six hours per cell, which is why we qualify on a sample of every production lot rather than 100 percent.
Temperature and SOC Dependence You Must Map
Resistance is not a single number. Our maps show DCIR climbing roughly 2.5 times from 25 degrees Celsius to minus 20 degrees Celsius, driven mainly by the semi-solid electrolyte conductivity dropping as the solvent freezes. Above 45 degrees Celsius resistance falls but aging accelerates, so we do not design around the hot number.
SOC matters too. Near full charge the cathode potential rises and charge-transfer resistance drops slightly, while near empty the diffusion term balloons because active lithium is scarce. We publish the worst-case DCIR at 10 percent SOC and minus 10 degrees Celsius as the design constraint for cold-start drone battery packs.
Acceptance Limits and Cell-to-Cell Matching
A number is useless without a limit. For production semi-solid state battery cells we gate on three rules. First, room-temperature DCIR at 50 percent SOC must be within plus or minus 10 percent of the qualified mean. Second, cell-to-cell variation across a lot must stay under 5 percent so pack balancing is manageable. Third, the DCIR at the cold worst case must not exceed 2.5 times the room-temperature value.
We also track DCIR growth during cycle life. A healthy cell stays within 20 percent of its initial DCIR through 800 cycles at 1C. If a cell crosses 30 percent growth before 500 cycles, we flag the lot for root-cause analysis rather than shipping it into a custom battery solution.
These same limits feed directly into our battery management system tuning. When a pack is built from cells with a verified DCIR spread under 5 percent, the active balancing current can be set lower, which reduces standby losses and extends calendar life in storage. We therefore report the per-cell DCIR distribution, not just a lot average, in every qualification dossier.
Instrumentation and Test Standards
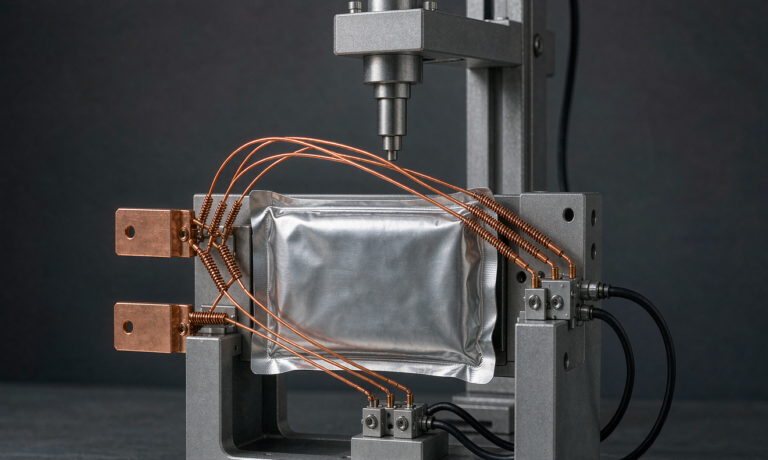
The hardware is simple but unforgiving. We use a four-wire Kelvin connection to remove lead resistance, a temperature chamber with plus or minus 1 degree Celsius control, and a cycler with sub-milliohm current accuracy. Calibration against a known shunt runs before every qualification batch.
On standards, IEC 61960-3 defines the DC internal resistance measurement for secondary lithium cells and is our primary reference. IEC 62660-1 covers power and capacity characterization for automotive cells and informs our pulse profile. UN38.3 and IEC 62133 govern the safety qualification every semi-solid state battery cell must pass before it reaches a customer, though they do not specify resistance methods. We fold resistance data into the same qualification dossier so the customer gets one complete report.
Frequently Asked Questions
What is the difference between DCIR and AC impedance?
AC impedance uses a small alternating current swept across frequencies to separate ohmic, charge-transfer, and diffusion behavior on a Nyquist plot. DCIR uses a real current pulse and reports the effective resistance under load. We use AC impedance to diagnose and DCIR to qualify.
How do you calculate DCIR from a pulse test?
After a discharge pulse, DCIR equals the total voltage change during both the discharge and charge pulses divided by twice the pulse current. Using both pulses cancels the open-circuit relaxation that occurs during the rest period between them.
Why does semi-solid electrolyte raise internal resistance?
The composite semi-solid electrolyte is more viscous than a liquid, so lithium ion mobility through it is lower. This raises the ohmic term of the total resistance, which is why semi-solid state battery cells show higher baseline DCIR than equivalent liquid cells.
What DCIR growth rate is acceptable over cycle life?
We accept up to 20 percent DCIR growth through 800 cycles at 1C. Crossing 30 percent before 500 cycles triggers lot-level root-cause analysis. These limits protect pack power and thermal margin in the field.
Which standard covers internal resistance measurement?
IEC 61960-3 is the primary reference for DC internal resistance of secondary lithium cells. IEC 62660-1 informs the power pulse profile. Safety frameworks like UN38.3 and IEC 62133 qualify the cell but do not define the resistance method.
How does temperature affect semi-solid battery resistance?
DCIR rises about 2.5 times from 25 degrees Celsius to minus 20 degrees Celsius as the semi-solid electrolyte conductivity falls. We design to the cold worst case at 10 percent SOC so drone battery packs retain usable power in winter conditions.
Further Reading
References