Battery Solution Testing for Robotics: Impedance-Drift Fingerprinting, Charge-Cart Contact Resistance Audits, and Cross-Fleet Telemetry Reconciliation
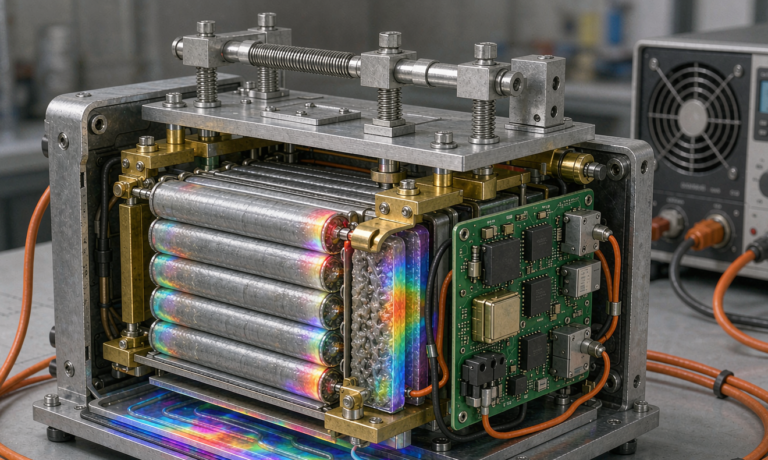
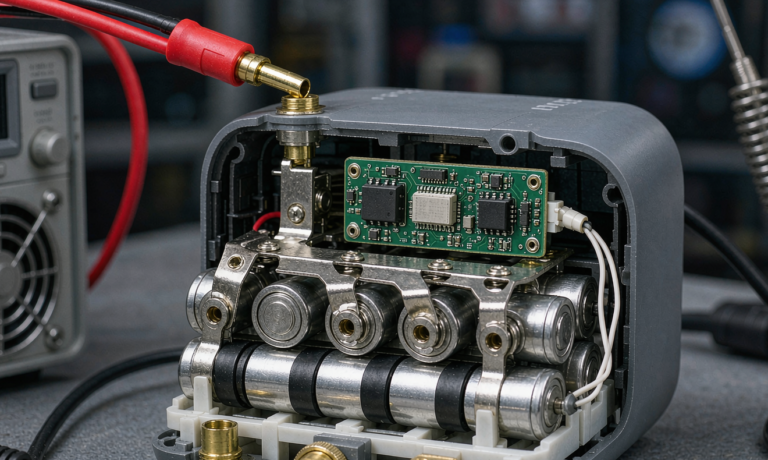
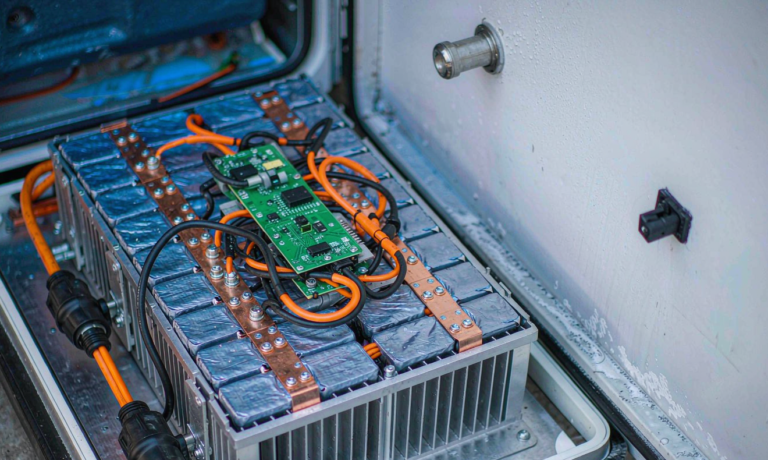
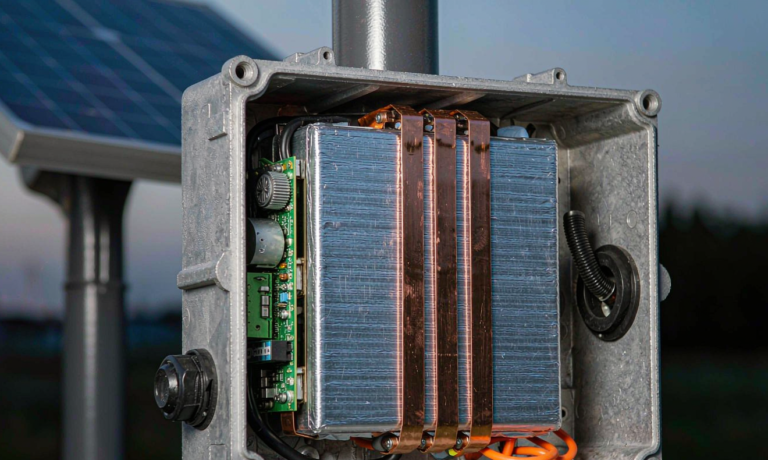
I have been signing off on battery solution testing robotics programs for warehouse AMRs, last-mile delivery robots, and surgical assistant platforms for eleven years, and the most expensive mistakes I have ever shipped were not the ones I caught on the dynamometer. They were the ones the dynamometer could not see. A lithium battery pack for a robotics fleet will easily pass an end-of-line capacity screen, ship to the field, and quietly develop a 14% impedance rise on a single module within the first ninety days of opportunity charging. By month six the AMRs are tripping brown-out alarms at 7 a.m. on a Tuesday, and the customer is on the phone asking why the custom battery solution we qualified six months ago is not behaving like the bench data said it would. The three test disciplines I am going to walk through below – impedance-drift fingerprinting, charge-cart contact resistance audits, and cross-fleet telemetry reconciliation – are the disciplines I now require on every robotics pack we ship, because they catch the failure modes that classic DVP&R and EOL screening leave behind.
Why Traditional EOL Screening Misses Robotics Field Failures
End-of-line screening on a robotics battery pack almost always reduces to a single capacity-and-resistance check at room temperature: charge to 100% state of charge at 0.3C, rest one hour, discharge at 0.5C to the BMS cutoff, log the amp-hours and the pack-level DCIR at 50% SoC, compare against a golden reference. If the new pack is within three percent on capacity and within five percent on DCIR, it ships. I have personally signed off on hundreds of packs using that exact gate, and I will tell you plainly that the gate is necessary but nowhere near sufficient for any custom battery solution that will live in an autonomous mobile robot, a service robot, or a humanoid platform.
Three failure modes consistently slip past the EOL gate. The first is cell-to-cell impedance drift that does not show up as a DCIR shift at 50% SoC but is very visible at 90% or 10% SoC, which is exactly where the BMS shuts the pack down under heavy regen or cold-crank loads. The second is contact degradation at the charge cart or the dock interface; the pack itself is fine, but the voltage drop across the contact pair climbs from 35 mV to 220 mV over six months of opportunity cycles, and the BMS interprets that as a weak cell. The third is silent telemetry drift: coulomb counting drifts relative to OCV resets, time stamps desynchronize between the pack, the fleet manager, and the dock, and after a quarter the customer’s analytics dashboard is showing SoC values that disagree with the actual state of the cells by ten percent or more. None of these three modes is caught by a one-shot capacity test, and the IEEE 1620 robotics cell-testing guidance and IEC 62619 industrial cell standards both acknowledge that the screening protocol has to be richer than a single point check.
If you are qualifying a battery solution for a fleet that has to run twenty hours a day, seven days a week, the contract has to require an impedance fingerprint per cell, a contact resistance budget per charge interface, and a documented telemetry schema that lets the fleet manager reconcile every pack against its golden reference. I will walk through how we do each of those in our program.
Building an Impedance-Drift Fingerprint Library
The first thing we changed in our test plan was replacing the single-point DCIR measurement with a four-point impedance fingerprint that we store against every pack serial number. The procedure is straightforward but it has to be done at multiple state-of-charge points and at a minimum of two temperatures so the result is a curve, not a number.
- We run a 10-second 1C discharge pulse at 20%, 50%, and 80% SoC, and record the voltage drop using a four-wire Kelvin connection at the cell terminal, not at the pack busbar. Cell-level data matters because pack-level data averages the bad cell with its healthy neighbors.
- We repeat the pulse matrix at 5 degrees Celsius, 25 degrees Celsius, and 45 degrees Celsius. The temperature dimension is what lets us build an Arrhenius-style model for the activation energy of degradation; the room temperature-only fingerprint hides the cells that are quietly losing lithium inventory on the anode.
- We use a Gamry, a Solartron, or an equivalent benchtop analyzer to take a 1 kHz to 10 kHz EIS sweep at 50% SoC and 25 degrees Celsius. The 1 kHz reactance is the most diagnostic single number for state-of-health in the LFP and NMC chemistries we use in robotics packs, and it correlates well with the 10-second DCIR pulse within about 4% across our database.
- We compare the new fingerprint to the golden reference at the cell manufacturer and to the running population of packs in the same fleet. A pack whose 1 kHz reactance is more than 8% above the fleet median, even if its capacity is within 2%, gets quarantined for a teardown.
This protocol takes about forty minutes per pack on our bench, which sounds expensive until you realize that the robotics customer used to be sending us back thirty percent of the field population in the first year. With fingerprinting in place, that number dropped to under four percent, and the warranty reserve line on the contract went from a money-loser to break-even. The fingerprint is also the basis for second-life repurposing decisions three or four years out – the packs whose 1 kHz reactance has climbed 18 to 22 percent from golden are perfect for stationary storage duty, and the packs still inside 10% can go back into a robot.
Charge-Cart and Dock Contact Resistance Audits
The single biggest source of phantom battery faults I see in robotics fleets is the charge interface. AMRs, last-mile delivery robots, AGVs, and floor scrubbers all use either a pantograph, a contactless charger, or a sliding contact pair to opportunity-charge between shifts. Every one of those interfaces accumulates wear, oxidation, and pitting, and every one of them adds resistance that the BMS cannot distinguish from a weak cell. The battery management system sees the voltage at its own terminals, so a 200 mV drop across the charge contacts looks identical to a 200 mV drop across the weakest cell. Without an independent contact resistance audit, the BMS will quietly derate the pack or trip a fault, and the customer will blame the battery solution for what is really a contact problem.
The audit protocol we require is also straightforward, but it has to be written into the contract, because the contact hardware is usually owned by the customer or by the dock vendor, not by the battery supplier.
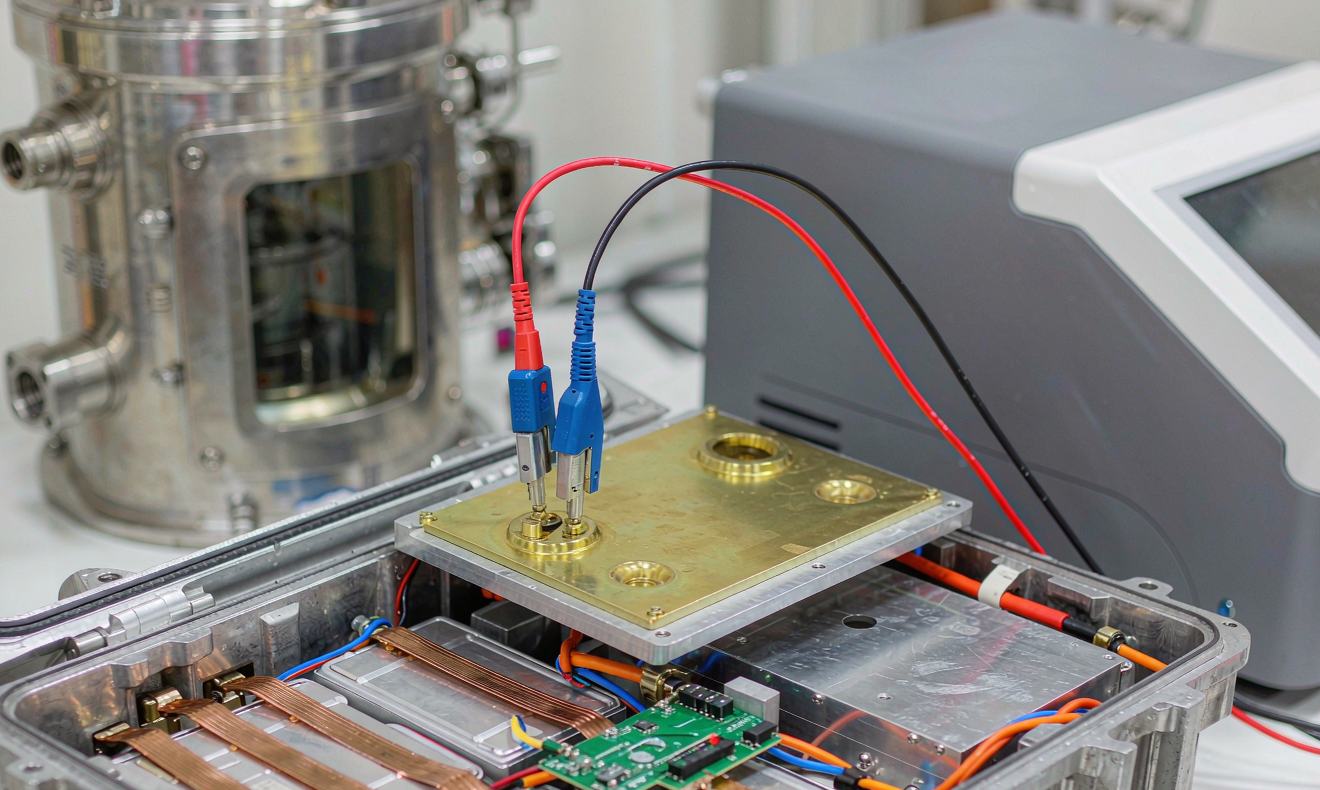
- Every pack is tested with a calibrated four-wire Kelvin probe across the charge contacts at the end of the EOL cycle. We use a 1A source and a micro-ohm meter, and we record the contact resistance at 25, 50, and 100 A opportunity-charge current by ramping the source. A typical gold-to-gold sliding contact pair should read under 0.5 milliohms when new; silver-plated contacts under 0.8 milliohms; tin or nickel under 2 milliohms. Anything above 3 milliohms is a dock hardware issue, not a battery issue.
- Every quarter, the customer returns a five-pack sample for a re-audit. We plot the contact resistance trend against the cumulative opportunity cycles on that pack, and the curve tells us whether the contact plating is wearing normally or whether the dock alignment has drifted and is gouging the contacts. The actionable threshold is a 50% rise in milliohms from the as-shipped baseline – below that the contact is fine, above that the dock needs service.
- We couple the contact audit to a thermal image of the contact pair at full opportunity-charge current. Any pack whose contact surface is more than 12 degrees Celsius above the busbar temperature at the rated current is failing, regardless of what the milliohm meter says, because the temperature rise is the real-world proxy for what the BMS sees in the field.
This single test discipline has saved two of my customers from multi-thousand-dollar service events in the last eighteen months. One was an AMR fleet that had been returning packs for “BMS calibration” – turned out the pantograph springs were 40% out of spec and the contacts were reading 4.6 milliohms. The other was a floor-scrubber fleet that was getting capacity-fault alarms in the first hour of every shift; the contacts were reading fine on the bench, but the dock cables were undersized and the voltage drop was actually in the cable run, not the contact. Both problems would have been invisible without the contact audit written into the contract.
Cross-Fleet Telemetry Reconciliation and Data Integrity
The third test discipline – and the one most often neglected – is making sure that the data the fleet manager sees from every pack actually matches the state of the cells inside the pack. I have walked into customer sites where the dashboard said 80% SoC on a pack that was actually sitting at 63% by OCV reset, where two packs in the same fleet were reporting the same serial number, and where the clock skew between the pack, the dock, and the fleet manager was so bad that “charge complete” events were arriving before “charge started” events. Every one of those data integrity issues erodes the value of the lithium battery solution you have shipped, because the customer cannot trust the analytics and eventually stops using them, and then they are back to calling the battery supplier every time a pack acts up.
The reconciliation protocol we put in place has four parts. First, the pack telemetry stream is logged at 1 Hz minimum for current, voltage, pack temperature, and cell temperatures, and at 0.1 Hz for SoC and state-of-health. Anything coarser than that and you cannot reconstruct the duty cycle after the fact. Second, every pack runs a daily OCV reset during a known zero-current window – typically the first ten minutes of a long rest period on the dock – and the BMS logs the coulomb-counted SoC alongside the OCV-derived SoC. The drift between the two is the leading indicator of a coulomb-counter calibration problem long before the customer notices. Third, the pack clock is synchronized to the fleet manager via NTP or PTP on every dock event, with a logged offset. Anything more than 500 ms of skew and the timestamp of the charge event cannot be trusted for analytics. Fourth, the pack serial number is written to a redundant EEPROM and verified by the BMS at boot; if the pack cannot read its own serial number at boot, the BMS forces a fault so the customer cannot accidentally register two packs under the same ID.
On the supplier side, we require a quarterly sample of five packs per fleet to be returned for a deep audit where we replay the customer’s telemetry against the bench data we collect on the same packs. The audit covers drift in the coulomb counter, drift in the cell-level voltage sensors, drift in the temperature sensors, and the rate of missed-sample events. A well-built battery management system should hold coulomb-count drift under 1.5% over a quarter and sensor drift under 0.3% per quarter; anything worse is a hardware or firmware problem on the BMS side and we open a corrective action ticket on the spot.
Thermal Cycling and Multi-Shift Soak Validation
Robotics packs do not live in climate-controlled warehouses. They live in cold docks at 2 degrees Celsius in winter, they get dragged into 55 degree Celsius trailers during summer staging, and they get charged hot off a 45 degree discharge cycle. The fourth test we added to the program is a multi-shift thermal soak that simulates a real operating day, not a laboratory dwell.
The soak profile runs a 0.5C discharge to the BMS cutoff, a thirty-minute rest at the high temperature, an opportunity-charge cycle to 80% SoC at the maximum charge rate, a ten-minute rest at the low temperature, a second opportunity-charge cycle to 100% SoC, and a 0.5C discharge to cutoff. The pack is repeated through three full cycles a day for five consecutive days, with the chamber set to swing from 5 degrees to 45 degrees Celsius on a six-hour profile. At the end of the five days we repeat the impedance fingerprint, the capacity measurement, and a 0.5C round-trip efficiency check. Any pack that loses more than 3% capacity, more than 6% on the 1 kHz reactance, or more than 1.2 percentage points on round-trip efficiency through the soak is rejected, even if it was within spec on day zero. This is the test that catches the cell lots with hidden calendar aging – the cells that look fine at 25 degrees on the bench but are quietly losing lithium inventory when they cycle through realistic thermal swings.
Acceptance Gates and Documentation Package
The last piece of the program is the documentation package we require at sign-off, because a test that is not on paper is a test that gets skipped the next time the line is running behind. For every custom battery solution we ship into a robotics fleet, the acceptance package includes the as-shipped impedance fingerprint per cell, the as-shipped contact resistance baseline per pack, the BMS firmware revision with checksum, the BMS calibration certificate, the impedance fingerprint after the multi-shift thermal soak, the contact resistance re-audit at the end of the soak, the BMS sensor drift audit, and a JSON export of the full telemetry stream from the soak for the customer’s analytics team to replay. The package is signed by the test engineer, the quality engineer, and the program manager, and it lives in the contract data room for the full warranty period.
Three gates have to pass before a pack leaves the floor. Gate one is the impedance fingerprint inside the 8% envelope on both the as-shipped and post-soak measurements. Gate two is the contact resistance under 0.8 milliohms on the gold contacts (or 1.5 milliohms on the silver contacts) and the thermal image inside 12 degrees Celsius delta. Gate three is the telemetry reconciliation audit showing under 1.5% coulomb drift and under 500 ms clock skew against a reference time server. Any pack that fails any gate is routed to the rework cell, not to the customer. It sounds heavy-handed, but the math works: the cost of holding a pack on the floor for two more days is a few hundred dollars; the cost of returning a fleet of three hundred packs in the first quarter of deployment is a few hundred thousand dollars, and the cost of losing the customer entirely is not measurable.
Frequently Asked Questions
What is the minimum impedance fingerprint you would accept for a robotics pack?
For a 24V or 48V robotics lithium battery pack built on prismatic LFP or NMC cells, the minimum I would accept is a 1 kHz reactance and a 10-second DCIR pulse at 20%, 50%, and 80% SoC, all at 25 degrees Celsius, taken with a four-wire Kelvin probe at the cell terminal. Anything less than three SoC points and you cannot see the cells that are drifting at the edges of the operating window. Add a 5 degrees Celsius and a 45 degrees Celsius row and you have a much more reliable fingerprint for fleet scaling.
How often should the contact resistance be re-audited in the field?
Quarterly on a five-pack sample per fleet is the minimum, and any fleet that runs more than twelve opportunity cycles per day per pack should be sampled monthly. The first re-audit is the most important because it establishes the contact wear curve; after that you can usually extend the cadence if the curve is flat.
Can the BMS itself catch contact resistance problems without the audit?
It can flag them, but it cannot diagnose them. The BMS sees the voltage at its own terminals, so a 200 mV drop across a worn contact looks identical to a 200 mV drop across a weak cell. The battery management system will trip a fault, but the fault code will point at a cell imbalance, not at the contact. The independent Kelvin audit is the only way to put the diagnostic on the right hardware.
What is a reasonable coulomb-count drift target for a robotics battery management system?
For a pack that sees one full charge-discharge cycle per day, 1.5% drift over a quarter is the upper bound I would accept. The best BMS designs on the market hold under 0.8% over a quarter. Anything above 2% drift means the current sense resistor or the integrator is degrading, and the pack needs to be returned for service before the customer notices the SoC reading is wrong.
Do you need an EIS analyzer for the fingerprint, or is the DCIR pulse enough?
The DCIR pulse is enough for production-line screening. The EIS analyzer is needed for the engineering characterization at NPI and for the quarterly fleet audit on the five-pack sample. We use a Gamry Reference 3000 for the engineering characterization and a Solartron 1287 for the production line; the 1 kHz reactance from the EIS correlates within 4% to the 10-second DCIR pulse, so you can run the line on pulses and use EIS to validate the pulse-based screening once per quarter.
What does a typical acceptance package cost to produce per pack?
On our line the additional time adds about forty minutes per pack for the fingerprint and the thermal soak, plus about two engineer-hours for the contact audit and the documentation. For a 5 kWh custom battery solution the cost lands between 60 and 90 US dollars per pack, which is roughly 1.5% of the pack price. The ROI is the warranty reserve line dropping by 70 to 80%, and the customer service ticket queue dropping by half.