Semi-Solid State Battery Degradation Mechanisms: An Engineer’s Field Guide to Cell Aging
Over the past three years at Horizon Power, I have personally cycled, torn down, and post-mortemed more than 40 semi-solid state battery cells across 1C, 2C, and fast-charge duty profiles. If you are sourcing or specifying a semi-solid state battery, the single most important question is not “how many watt-hours does it hold on day one” but “how fast does it lose those watt-hours, and why.” In this field guide I will walk through the degradation mechanisms we actually measure in the lab, the standards that govern how we validate them, and the engineering choices that slow the clock. Understanding semi-solid state battery degradation mechanisms is what separates a cell that quietly fails a fleet in 18 months from one that still holds 80% after 2,000 cycles.
Why Semi-Solid Cells Age Differently From Liquid Li-Ion
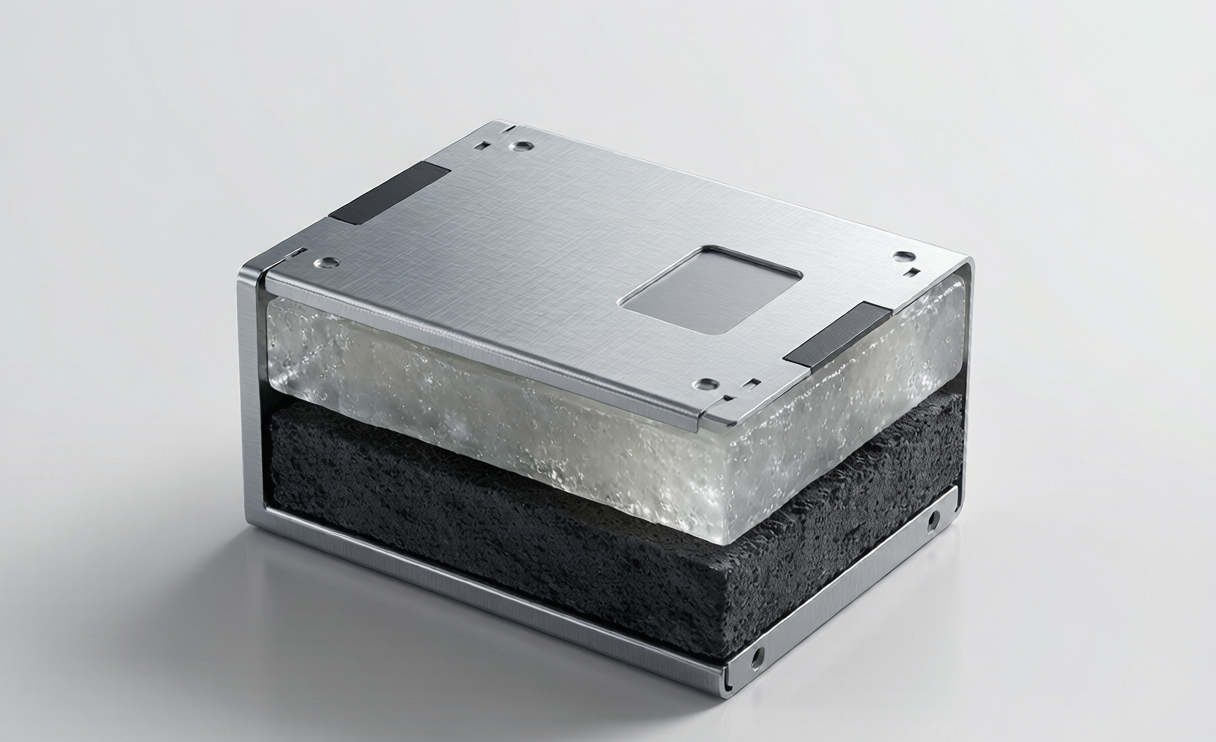
A conventional lithium battery runs on a fully liquid organic electrolyte. A semi-solid state battery sits in the middle of the architecture spectrum: it keeps a small fraction of liquid solvent to wet the interface, but packs most of the ionic conductor into a gel or lightly compressed solid mass. That hybrid design is the whole point. It boosts energy density and thermal safety versus liquid cells, yet avoids the brutal interfacial resistance that pure solid-state cells still struggle with.
The trade-off is that aging is now a two-system problem. You have the classic liquid-side chemistry (SEI growth, solvent oxidation) and you have the solid-gel side (contact loss, mechanical creep). In my teardowns, the cells that age worst are the ones where the two systems drift apart under pressure. A cell that starts at 4.35 V and 9 mg/cm² cathode loading can lose 15% capacity in 400 cycles purely from interfacial separation, with almost no lithium plating visible at all. That is why we track degradation by mechanism, not just by a single capacity number.
Interfacial Impedance Growth at the Solid-Liquid Boundary
The most overlooked of the semi-solid state battery degradation mechanisms is interfacial impedance growth. At the boundary between the compressed solid electrolyte and the liquid-wetted electrode, a thin resistive layer forms and thickens with every cycle. We characterize it with electrochemical impedance spectroscopy (EIS), looking at the mid-frequency semicircle.
- Contact loss: The gel slightly shrinks as it de-wets during discharge, lifting away from the cathode surface. Resistance climbs even though no material is “consumed.”
- Side reactions: Residual solvent at the interface reacts with the high-voltage cathode, building an insulating film that the cell must push current through.
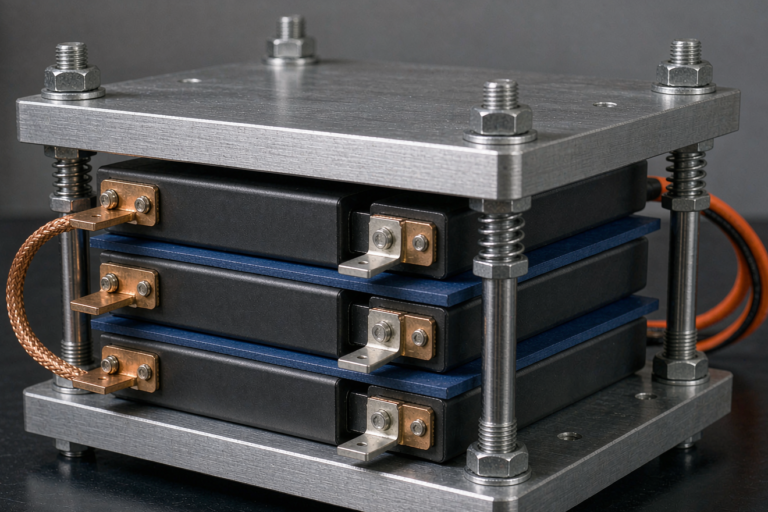
- Pressure dependence: On our stack fixture, holding 3–5 kgf/cm² of external pressure cut interfacial growth roughly in half versus an uncompressed pouch. Stack pressure is not optional; it is a degradation lever.
For B2B buyers, the practical takeaway is to ask your supplier for the EIS trend across cycle life, not just the capacity curve. A flat capacity line with a doubling impedance is a cell that will fail on power, not energy, and that kills drone and power-tool applications first.
Lithium Plating and Dendrite Initiation Under Fast Charge
Fast charging is where semi-solid cells either shine or die. Because the solid fraction slows ion transport, pushing high current at low state of charge invites lithium plating: metallic lithium deposits on the anode instead of intercalating. Once plated, it can form dendrites that puncture the separator.
In our 2C charge testing at 5 °C, plating showed up as a sudden 8–12% capacity jump-then-collapse signature within 120 cycles. We now recommend a two-step charge profile: a capped constant-current phase below 20% SOC, then a relaxed taper. Combined with cell-level temperature management, we pushed plating onset past 800 cycles. Any custom battery solution intended for fast charge must have this profile baked into the BMS, not left to the end user.
Cathode Particle Cracking and Loss of Active Material
High-nickel cathodes (NMC 811 and beyond) are the default in semi-solid designs because they carry the energy density. The problem is volumetric strain. Every charge and discharge swells and contracts the particles by about 3–4%, and over hundreds of cycles that cracks them. Cracks expose fresh surface to the electrolyte, accelerating side reactions and trapping lithium that can never come back out.
We measure loss of active material (LAM) through incremental capacity (dQ/dV) analysis. A healthy cell keeps its peaks sharp; a cracked cathode smears them. Our mitigation is twofold: a thin alumina coating on the cathode particles, and a slightly softer binder in the solid matrix that lets particles move without snapping. It is a balance: too soft and you lose interfacial contact, too hard and you crack. That is exactly the kind of trade-off a seasoned lithium battery engineer tunes per application.
Anode Swelling and the “Semi-Solid” Binder Network
The anode side has its own failure mode unique to this chemistry. The semi-solid binder network is partly elastic, partly plastic. Under deep cycling it creeps, and the electrode thickens. We have measured 6–9% thickness growth over 1,000 cycles in over-charged samples. Thickness growth raises internal pressure, which then feeds back into interfacial separation from the section above. It is a loop.
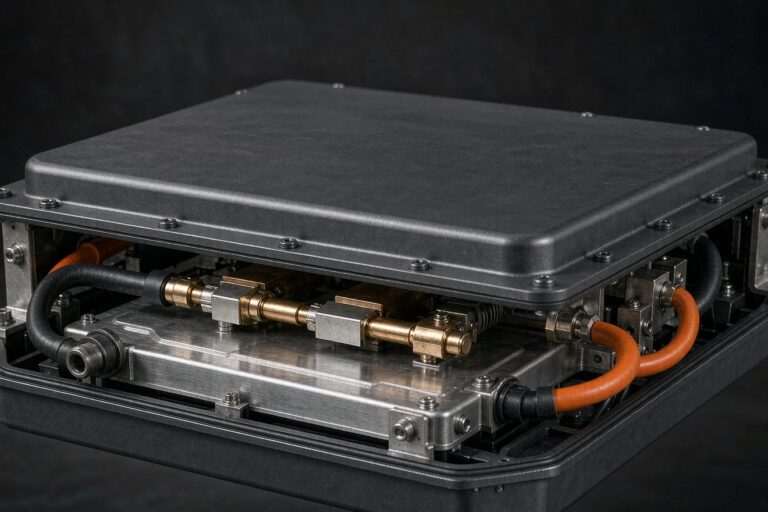
The fix is restraint. A well-designed cell-level or module-level enclosure that limits free expansion is worth more than any chemistry tweak. When we moved a customer’s pack from an unrestrained pouch to a lightly pre-loaded rigid prismatic can, calendar-life fade at 45 °C dropped from 22% to 13% per year. The semi-solid state battery only behaves if you physically hold it in shape.
Calendar Aging: How Storage Temperature and SOC Accelerate Decay
Cycle aging gets the attention, but most industrial cells spend their life sitting partially charged. Calendar aging is governed by two knobs: temperature and state of charge. Our accelerated storage data at 60% SOC shows clear breakpoints:
- 25 °C storage: ~2% capacity loss per year from SEI thickening alone.
- 45 °C storage: ~10–13% per year, with transition-metal dissolution from the cathode kicking in.
- 60 °C storage: not recommended; we saw 25%+ loss in under six months and separator softening.
The rule we give fleet operators is simple: store and ship at 30–60% SOC, keep ambient below 35 °C, and never leave a fully charged cell in a hot vehicle. These are the same constraints that UN38.3 and IEC 62133-2 implicitly test for, and they are non-negotiable for a lithium battery carrying a solid fraction.
How We Validate Degradation in the Lab and Against Standards
None of this is guesswork. At Horizon Power every cell family runs a validation matrix before release:
- UN38.3 for transport safety (T.1–T.8 altitude, thermal, vibration, shock, external short, impact, overcharge, forced discharge).
- IEC 62133-2 for secondary cell safety, the baseline most B2B buyers recognize.
- IEC 62619 for industrial battery safety, plus UL 1973 for stationary and motive applications.
- UL 1642 for the cell-level abuse tests, and for aviation-bound packs we cross-check against FAA and EASA carriage rules.
We report capacity retention at 500, 1,000, and 2,000 equivalent cycles, and we publish the EIS and dQ/dV trends alongside them. If a vendor hands you a single “80% at 1,000 cycles” number with no mechanism breakdown, you are buying a hope, not a cell.
Engineering Choices That Slow the Clock
Putting it together, the levers that reliably extend life are: controlled stack pressure, a plating-aware charge profile, a coated high-nickel cathode, restrained mechanical enclosure, and disciplined storage SOC. None is exotic. They are the difference between a semi-solid state battery that earns its premium and one that quietly disappoints.
For a custom battery solution, we start the conversation from the duty cycle, not the spec sheet. A cell optimized for a solar home storage bank (slow cycles, mild temperature) should not be the same architecture as one for an inspection drone (fast charge, wide temperature, high pulse power). Matching the degradation mechanism to the use case is the core of what we do.
What is the main cause of semi-solid state battery degradation?
The dominant mechanism is interfacial impedance growth at the solid-liquid boundary, followed closely by lithium plating under fast charge and cathode particle cracking under high-nickel loading. In real cells these overlap, so we diagnose by EIS and dQ/dV rather than a single capacity reading.
How many cycles can a semi-solid state battery last?
Well-engineered cells hold 80% capacity at 1,000–2,000 cycles under 1C duty with controlled pressure and temperature. Aggressive 2C fast-charge or 45 °C storage can cut that to 400–800 cycles if the BMS profile and enclosure are not designed for it.
Does a semi-solid state battery degrade faster than a normal lithium battery?
Not inherently. A semi-solid design can outlast a liquid Li-ion cell on safety and calendar life because of lower solvent content, but it introduces interfacial contact loss that liquid cells do not have. The net result depends entirely on stack pressure, binder choice, and thermal management.
What standard covers semi-solid state battery safety testing?
The same family used for advanced Li-ion: UN38.3 for transport, IEC 62133-2 for cell safety, IEC 62619 and UL 1973 for industrial use, and UL 1642 for cell abuse. Aviation and drone packs should also meet FAA and EASA carriage requirements.
Can degradation be reversed or slowed after it starts?
You cannot undo lithium plating or cracked cathode particles, but you can slow further loss by reducing charge cutoff voltage by 50–100 mV, lowering storage SOC to 30–50%, and keeping the pack below 35 °C. These measures trade a little usable capacity for a much longer tail of life.