Semi-Solid State Battery Cell Formatting and Stack Pressure: A Manufacturing Engineer’s Guide to Yield and Cycle Life
I have spent most of my career on the manufacturing side of lithium cells, and if there is one lesson the last three years have hammered home, it is this: the chemistry gets the press release, but cell formatting and stack pressure decide whether a semi-solid state battery ever ships. I am Karl Huang, a senior lithium battery engineer, and the failures I get called in to diagnose are rarely exotic. A pilot line builds beautiful 5 Ah coupons in the lab, everyone signs off, and then the first 2,000-cell production lot comes back with 18% off-spec capacity and a thickness distribution that looks like a badly tuned histogram. Nine times out of ten, the root cause is that nobody treated pressure as a process variable.
That is what this article is about. Not the marketing version of semi-solid electrolytes — the version where you have to hold a gel-polymer layer in intimate contact with a 20 mg/cm² cathode for 3,000 cycles while the stack breathes, gasses, and swells. I will walk through what “semi-solid” means physically on the line, why external pressure is load-bearing rather than optional, how I write a formation recipe, how the fixture itself becomes a measurement instrument, and where yield actually leaks. If you are specifying a custom battery solution for aviation, medical, or grid applications and your supplier cannot answer the pressure questions below, that is a meaningful signal.
What “Semi-Solid” Actually Means on the Line
The term covers a wide family, and the differences matter enormously for process design. A conventional lithium battery uses a fully liquid carbonate electrolyte that wicks into electrode porosity and stays there. An all-solid-state cell replaces it entirely with a ceramic, sulfide, or polymer ion conductor. A semi-solid state battery sits in between: a gel-polymer or composite electrolyte where the liquid fraction has been cut to roughly 5–15 wt%, with the remainder being a polymer host (PVDF-HFP, PEO, or a UV-cured acrylate), a ceramic filler such as LLZO or LATP, and the lithium salt.
That residual liquid is doing real work. It carries the ionic conductivity that a dry polymer cannot reach at room temperature, and it is the reason a semi-solid cell can be built on most of the existing coating, calendering, and stacking equipment rather than requiring a completely new dry-room process. But it also means the cell is not wetting itself. A conventional electrolyte with a viscosity around 3–5 mPa·s floods a porous electrode in minutes. A semi-solid precursor can be two to three orders of magnitude more viscous, and in practice that converts wetting from a capillary process into a thermally activated diffusion process.
On our lines we budget 12–48 hours of wetting at 40–60 °C before the first charge, depending on electrode loading and porosity. Cathodes in the 15–25 mg/cm² range with 30–40% porosity are the norm; push porosity below 28% and wetting time roughly doubles while the rate capability you gained from calendering is thrown away by tortuosity. This is the first place semi-solid programs underestimate cost: the wetting oven is floor space, and floor space is schedule.
Ionic Conductivity Is a Contact Problem, Not Just a Material Property
Suppliers quote electrolyte conductivity from a coin-cell measurement, typically 0.5–3 mS/cm at 25 °C for a good gel system. What you actually get in a 40-layer pouch is lower, because the number that governs DC resistance is the interfacial contact area between the electrolyte and the active material particles. If the stack is under-compressed, microscopic voids form at that interface during the first lithiation, and the local current density in the remaining contact spots rises. High local current density is how you grow lithium dendrites, and dendrites are how you get a soft short that shows up as a K-value failure three weeks later.
Why Stack Pressure Is Not Optional
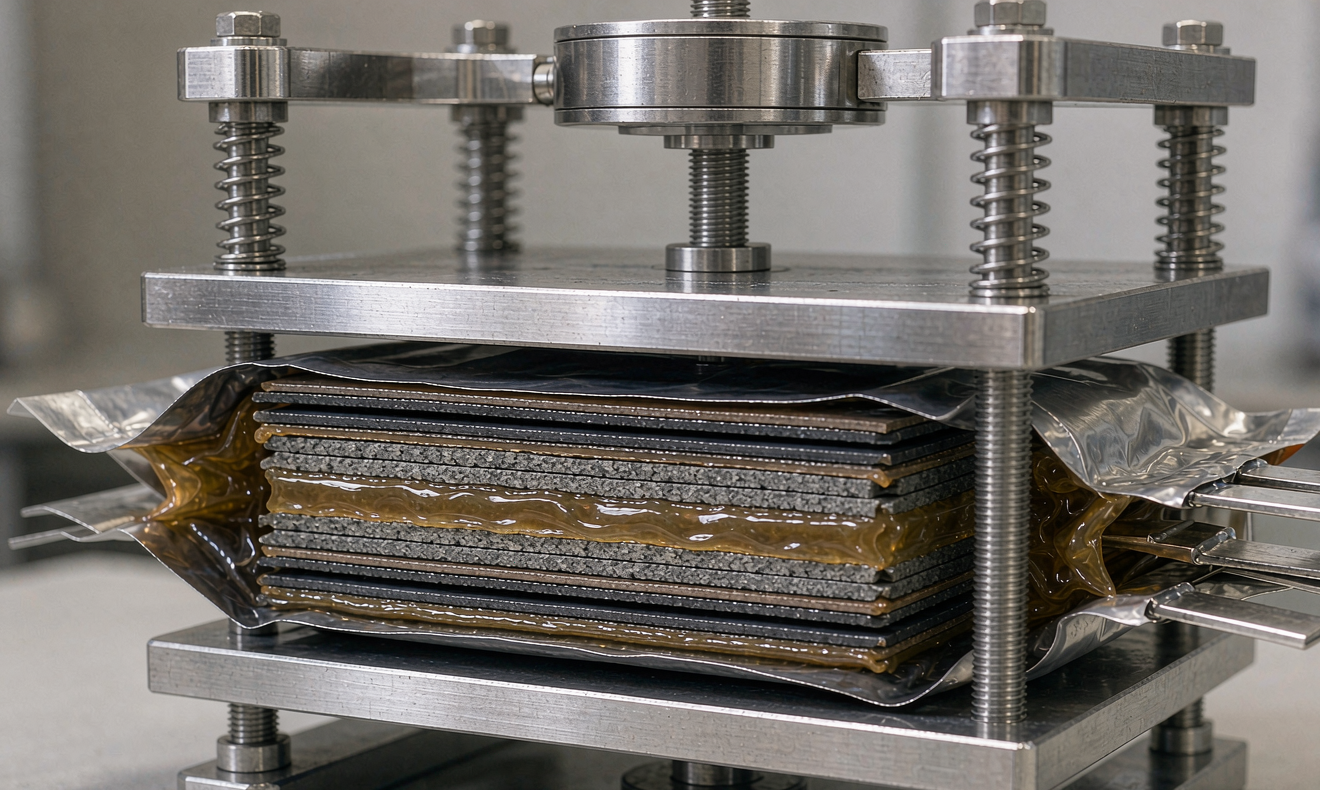
External pressure on a semi-solid or solid-state stack does four jobs at once. It maintains electrode-to-electrolyte contact as the silicon-blended or lithium-metal anode expands. It suppresses void formation and delamination at the interface. It keeps the lithium deposition morphology dense and planar rather than mossy. And it holds the stack flat so that current distribution stays uniform across the full electrode area instead of concentrating near the tabs.
The numbers vary by chemistry and I want to be honest about that, because there is no universal constant. For gel-polymer semi-solid pouch cells at modest rates, we hold roughly 0.2–0.5 MPa of static compression and see good results. For composite cathodes with higher ceramic content, 0.5–1.5 MPa is typical. Sulfide-based all-solid-state systems generally want 2–10 MPa, and some oxide-based designs are tested above 20 MPa. If a supplier quotes you a single pressure number without stating the chemistry, the electrode composition, and the rate capability target, treat it as a placeholder rather than a specification.
Two failure modes dominate when pressure is wrong. Too little, and you get contact loss: DCIR climbing 20–40% over the first 200 cycles, capacity fade accelerating after the knee, and a cell that looks healthy at beginning-of-life but fails the 500-cycle check. Too much, and you crush the separator or the polymer host, close the porosity you need for ion transport, and — in the worst case — force the compliant layer to extrude out of the stack edge and create an internal short path. The usable window is real but it is not wide, and on a new chemistry we map it empirically rather than guessing.
Cell Formatting: The Formation Protocol
Formation — the first controlled charge and discharge — is where the solid electrolyte interphase is built, and in a semi-solid cell it is where the mechanical state of the stack is established for the rest of its life. The SEI consumes lithium inventory irreversibly; on a graphite system that is typically 5–12% of the cyclable lithium, which shows up as first-cycle coulombic efficiency in the 85–92% range. On a lithium-metal or silicon-bearing anode the loss can run higher, and anode-free designs have to be pre-lithiated to compensate.
My standard formation recipe for a semi-solid pouch looks like this:
- Wetting soak: 12–48 h at 45 °C under initial fixture load, open circuit, with OCV logged every 60 s. A cell that drifts more than 20 mV during soak has a contamination or micro-short problem and is pulled before it wastes a formation channel.
- First charge: 0.02–0.05 C to 3.0 V, then a hold, then 0.1 C to the formation top voltage. The slow ramp is non-negotiable; the SEI grows preferentially at low current density and a fast ramp gives you a porous, unstable film.
- Degassing: formation gas — mostly CO₂, CO, CH₄, and C₂H₄ from carbonate reduction — is removed under 5–30 kPa vacuum for 2–10 s before the second seal. Skipping this is the single most common cause of a swollen cell in a customer’s hands.
- First discharge: 0.1 C to the cut-off, which gives the true deliverable capacity and the efficiency number.
- Conditioning cycles: two to three cycles at 0.2–0.33 C to stabilise the interphase before capacity grading.
Temperature interacts with every one of these steps. Formation at 45 °C speeds wetting and shortens the cycle, but it also grows a thicker, more organic-rich SEI that costs you a couple of percent of capacity and slightly raises room-temperature DCIR. Formation at 25 °C gives a thinner, denser film with better calendar life, at the cost of a much longer process. We generally formation-age at 30–35 °C as a compromise and then verify with a 7-day, 45 °C storage test.
The K-Value Screen Is the Cheapest Yield Insurance You Will Ever Buy
After formation the cells rest for 7–14 days at a controlled 25 °C with OCV logged daily. A healthy lithium cell drops less than about 5 mV over that period. A cell with a conductive particle bridging the separator drops faster and keeps dropping, and the drop rate — the K-value, in mV/day — separates the micro-shorts from the merely noisy. Screening at K < 0.05 mV/day costs you calendar days and nothing else, and it catches the population that would otherwise come back as a field failure eighteen months later. Every serious manufacturer does this. Ask to see the distribution, not the pass rate.
Fixture Design: Springs, Belleville Washers, and Load Frames
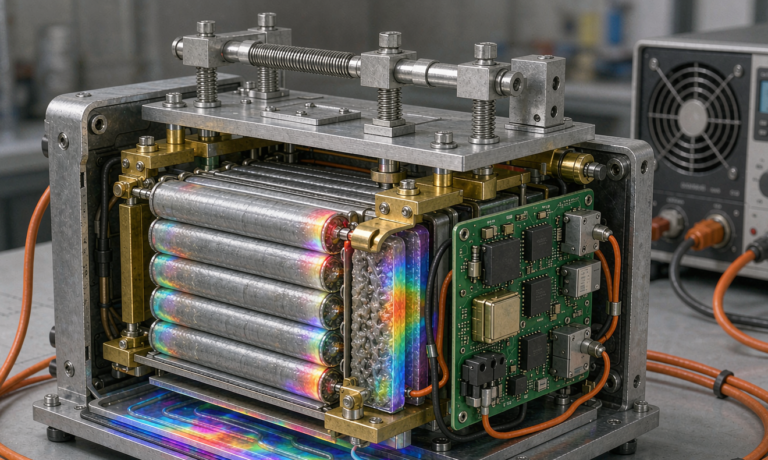
Here is the part that separates a lab program from a production one. In the lab, a technician bolts a fixture to a torque spec and moves on. In production, that fixture has to hold its load through thousands of hours of thermal cycling and hundreds of microns of stack thickness change, and it has to do it identically across 2,000 positions.
Coil springs are the default because they are cheap, but they have a stiffness — typically delivering 10–20% load loss over the first few hundred cycles as the stack relaxes and the spring settles. That decay is not a constant: it depends on where in the stroke you started. Belleville washer stacks are far flatter over their working range and are my preference for anything with a tight pressure window. Constant-force springs and pneumatic or hydraulic bladders are the gold standard for large-format cells, at real cost. Gas-loaded fixtures with a pressure regulator will hold ±2% indefinitely, which is why they show up in any serious long-cycle validation campaign.
Pressure uniformity across the electrode area matters as much as the average. A rigid aluminium plate that is 0.3 mm out of flat will load the centre and starve the edges, and you will see it in the post-mortem as a ring of lithium plating around a healthy-looking centre. We specify plate flatness to 0.05 mm and insert a compliant layer — a 0.5–1.0 mm silicone or PU pad — between the plate and the cell to convert point loads into a distributed field. Target is ±10% across the active area, verified with pressure-indicating film during qualification.
Instrumenting the Fixture Turns It Into a Sensor
If you put a load cell or a strain-gauged tie-rod in the fixture, thickness growth becomes a live measurement instead of a destructive teardown. That is genuinely useful, because swelling is the earliest and most honest indicator of what is happening inside a semi-solid cell. Formation swelling of 3–8% is normal as the SEI builds and gas evolves. Anything beyond that at formation, or continued growth past about 10% during cycling, means you are either plating lithium or generating gas continuously — and both of those end badly.
I also log the fixture load itself. A cell that is gassing pushes back against a constant-gap fixture, and the load trace will tell you which cells are gassing before the thickness gauge does. On one aviation program this single signal let us pull a bad electrode coating lot about six weeks earlier than the capacity data would have flagged it.
Measuring What Matters
Four numbers carry most of the signal in a semi-solid development program:
- DCIR measured with a 10 s, 1–2 C pulse at 50% SoC and 25 °C, plus a repeat at 0 °C and 45 °C. Track the delta from beginning-of-life, not the absolute value — a 20% rise in the first 200 cycles is a contact-loss signature.
- ACIR at 1 kHz for the ohmic component, which isolates contact and electrolyte resistance from the charge-transfer contribution.
- Thickness at 100% SoC and 0% SoC, measured under a defined reference load. The reversible breathing is typically 1–3%; the irreversible growth is the number that matters.
- Capacity retention and energy efficiency at the actual application rate, not at C/10. A cell that looks excellent at C/10 and falls apart at 2 C is a cell with a contact or tortuosity problem, and semi-solid cells are more sensitive to this than conventional ones.
For qualification we run the standard transport and safety set — UN38.3 (T1–T8), IEC 62133-2 for portable-sealed cells, IEC 62660-1 for automotive-style performance testing, UL 1642 or UL 2054 depending on the target market, and GB/T 38031 where the customer is shipping into China. For any air-transport or aviation application, the pressure question gets asked again at pack level, because the fixture that held the cell is not the structure that will hold it in service.
Yield Killers and How We Screen Them
Most semi-solid yield loss lands in four buckets, in rough order of frequency:
- Incomplete wetting — shows as high DCIR and low capacity that partially recovers after a second high-temperature soak. Caught by the soak OCV drift screen.
- Metallic contamination — shows as elevated self-discharge. Caught by the K-value screen and by in-line metal detection on the coated electrode.
- Stack misalignment — shows as a soft short or a capacity outlier. Caught by post-stack vision inspection and by the insulation-resistance check at 500 V DC, which should read well above 1 MΩ.
- Pressure non-uniformity — shows as plating rings and a bimodal capacity distribution. Caught by pressure film qualification and by tightening the thickness binning.
Realistic first-pass yield on a maturing semi-solid line is 85–95%. Capacity binning to ±2% and DCIR binning to ±5% is what makes a pack designable; a supplier who ships untrimmed distributions is handing you a balancing problem you did not budget for. Custom battery solution programmes for aviation and medical customers routinely add 100% X-ray or CT inspection of the stack edge, and on the medical implant work I have supported, that is not optional.
From Lab Coupon to Production
The scaling trap is that pressure and formation are coupled to cell size. A 0.5 Ah single-layer coupon wets quickly, heats uniformly, and sees a nearly ideal pressure field. A 20 Ah, 40-layer pouch does none of those things. Heat generated during formation has to travel through the stack, so the core runs hotter than the surface, the SEI formed in the core is different from the SEI at the surface, and the resulting cell is laterally non-uniform in a way the coupon never was.
What works: scale layer count first, then electrode area, and re-map the formation recipe at every step rather than interpolating. Add thermocouples on the pouch surface and, during development, inside the stack. Slow the formation rate as thickness increases — a 0.05 C ramp means something different when the thermal mass triples. And re-qualify the fixture at full size, because the flatness tolerance that was fine on a 60 mm plate is not fine on a 300 mm one.
None of this is glamorous, and none of it makes the press release. But the programmes that reach production are run by teams who instrumented the fixture, logged the load, screened the K-value, and treated pressure as the process variable it is.
Frequently Asked Questions
How much stack pressure does a semi-solid state battery need?
It depends on the electrolyte and electrode design. Gel-polymer semi-solid pouch cells typically run 0.2–0.5 MPa; composite cathodes with high ceramic filler content generally want 0.5–1.5 MPa; sulfide all-solid-state systems commonly need 2–10 MPa. Ask your supplier for the pressure window along with the rate capability and cycle life target it was validated at, not a bare number.
What happens if the stack pressure is too low?
You lose interfacial contact. The signature is DCIR rising 20–40% over the first 200 cycles, capacity fade accelerating past a knee, and — in lithium-metal or fast-charge designs — mossy lithium deposition and soft shorts. Low pressure also lets formation gas pocket between layers, which shows up as thickness growth and uneven current distribution.
Can too much pressure damage a semi-solid cell?
Yes. Over-compression collapses electrode porosity and the polymer host, raises tortuosity, and reduces rate capability. At the extreme it extrudes the compliant electrolyte layer out of the stack edge and can create an internal short. This is why we characterise both edges of the window rather than just the minimum.
Why does formation take so long on semi-solid cells?
Two reasons. Wetting is diffusion-limited rather than capillary-driven, so a 12–48 h high-temperature soak precedes the first charge. And the SEI must be grown slowly — typically 0.02–0.05 C to 3.0 V — otherwise the film is porous and unstable, which costs cycle life later.
What is the K-value and why is it screened?
The K-value is the open-circuit voltage decay rate in mV/day during a 7–14 day rest after formation. A healthy cell drops less than roughly 5 mV total. A faster, continuing drop indicates an internal micro-short from metallic contamination or separator damage. It is the cheapest high-value screen in the whole process.
How much swelling is acceptable?
Formation swelling of 3–8% is normal and mostly irreversible gas and SEI volume. Reversible breathing between 0% and 100% SoC is typically 1–3%. Continued growth beyond about 10% of initial thickness during cycling is a warning of plating or continuous gassing and should trigger a teardown.
Which standards apply to semi-solid cells?
The same transport and safety framework as conventional lithium cells: UN38.3 (T1–T8) for transport, IEC 62133-2 for sealed portable cells, IEC 62660-1 for performance testing, UL 1642 or UL 2054 for North American product safety, and GB/T 38031 for traction applications in China. Aviation and medical programmes layer additional customer-specific qualification on top.
Practical Takeaways
If you take one thing from this: ask the pressure question early. Which pressure, held by what mechanism, verified how, over what thickness range, for how many cycles. The teams that can answer it with data rather than adjectives are the teams that will deliver a semi-solid state battery that behaves the same in month thirty as it did in week one. Everything else — the conductivity figure, the Wh/kg headline, the cycle-life claim — is downstream of that one number being real.