Drone Battery Performance for Racing Drones: Building the
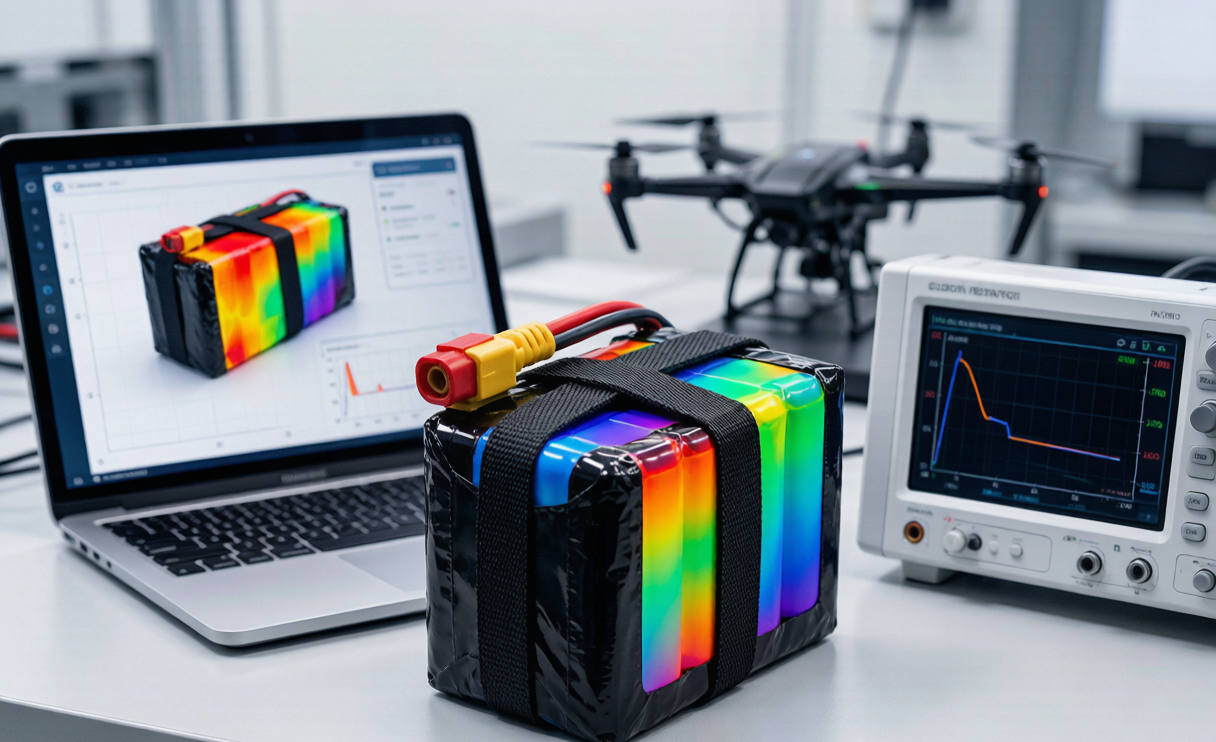
As a senior lithium battery engineer who has spent more race seasons than I care to count strapping packs onto FPV frames, I have learned one humbling truth: the number printed on a LiPo pouch — “45C”, “100C”, “1300 mAh” — tells you almost nothing about what happens on the third corner of lap four. The C-rating is a marketing average; the race is a sequence of 150-amp spikes, sub-second recoveries, and a thermal envelope that closes in on you long before the drone battery is “empty.” Over the last three years our team at Horizon Power stopped guessing and started modeling. We now build a lightweight electro-thermal digital twin of every race pack before it ever leaves the bench. In this article I will walk you through exactly how we do it — the equivalent-circuit model, the 30-minute parameter extraction, how we replay real lap data through it, and how the twin lets us screen pack configurations without soldering a single cell.
Why the Spec Sheet Always Over-Promises on Race Day
A 6S 1300 mAh 45C label implies 58.5 A continuous and roughly 117 A burst. But FPV duty is bursty: instantaneous demands of 100–200 A for 200–400 ms during a punch-out, then 20–40 A while cruising. The cell’s instantaneous C-rate at a 200 A spike on a 1300 mAh drone lithium battery pack is about 153C — far beyond the labeled 45C, which describes a sustained average, not a transient. The label also ignores voltage sag. At 150 A a pack with 12 mΩ of internal resistance per cell (about 72 mΩ across a 6S string) drops 10.8 V instantly, turning a 25.2 V drone lithium battery into 14.4 V at the ESC — below the gate threshold that triggers a brown-out. Real drone battery performance is governed by terminal voltage under load, not by the mAh number on the pouch. That is the first thing the digital twin captures, and it is why our race-day go/no-go decision never relies on the printed rating.
The Equivalent-Circuit Model I Run Before Every Event
We use a second-order RC equivalent-circuit model (ECM). An Rint model is too crude — it cannot represent the recovery you feel between heats — and a full electrochemical pseudo-two-dimensional model is far too slow to replay 10,000 laps overnight. The ECM balances fidelity and speed:
V_terminal = OCV(SOC) − I·R0 − (V_rc1 + V_rc2)
Each RC branch carries its own time constant: τ1 ≈ 0.4 s for the fast polarization that dominates a punch-out, and τ2 ≈ 8 s for the slow diffusion tail that builds up over a lap. OCV(SOC) is a lookup table built from a slow 0.2C discharge. The part that makes the model useful is that R0, R1 and R2 are all temperature-dependent — we fit R(T) = R_ref · exp(Ea/Rg · (1/T − 1/T_ref)). This coupling is what lets the twin predict lap-four sag: as cells warm from 30°C to 48°C, R0 drops by about 25%, which helps, but the accumulated polarization from repeated bursts grows faster, which hurts. The model captures both effects at once instead of forcing you to guess.
Extracting Real Parameters in a 30-Minute Bench Session
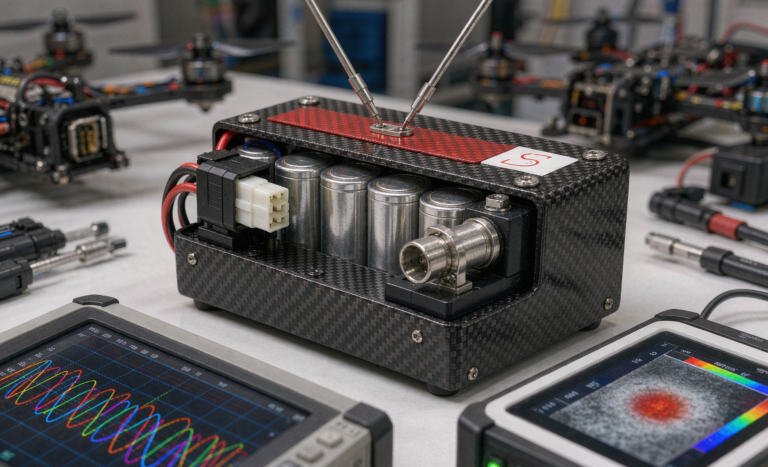
We never trust vendor datasheets for race packs. On our cycler we run three short steps:
- Slow OCV table — a 0.2C discharge at 25°C to map OCV vs SOC across 40 points. This anchors the open-circuit behavior.
- Hybrid Pulse Power Characterization (HPPC) at 50% SOC — a 10 s discharge pulse at 20 A, 40 s rest, then a 10 s regen pulse at −10 A. From the instantaneous step we read R0 (ΔV/ΔI in the first 100 ms, about 12 mΩ). From the relaxation tail we fit τ1, τ2, R1 and R2.
- Temperature anchors — we repeat the HPPC at 10°C, 25°C and 45°C to fix the R(T) curve.
For a typical 6S 1300 mAh 45C racing pack we measured R0 = 11.8 mΩ/cell, R1 = 4.2 mΩ, R2 = 2.1 mΩ at 25°C. That gives a 10-second DCIR of about 13.5 mΩ/cell, or roughly 81 mΩ across the 6S string before the harness. The “45C” label, by contrast, implies only ~5.8 mΩ/cell at its own definition (25.2 V / 58.5 A). The bench tells the truth: the usable C-rate at our 18.0 V gate is closer to 30C, not 45C. Every lithium battery we characterize follows this same honest measurement routine.
Replaying a Real Lap Through the Model
This is where the work pays off. We log a qualifying lap on the actual track with a 200 Hz current shunt and a per-cell voltage tap using Kelvin sense. Then we feed that current trace — all 90 seconds of it, roughly 18,000 samples — into the twin as the input I(t), and integrate SOC backward from the starting charge (we race at 4.20 V/cell, calibrated to 100%). The model outputs, second by second: terminal voltage, per-cell temperature, and remaining SOC.
Last season at a tight technical track, the twin flagged what the pilot’s gut nearly missed: on lap three, a 210 ms punch-out pulled the pack to 17.9 V — 0.1 V below our 18.0 V gate — for 210 ms before recovering. The real drone battery would have browned-out the ESC and cost the heat. Because we saw it in the simulation 48 hours before the event, we swapped to a 6S2P 1300 configuration (2,600 mAh, half the per-cell current) and the replay stayed above 18.6 V everywhere. No pack built, no track time wasted — just a model run. That single afternoon of simulation saved a full build cycle and a lost qualification.
Pre-Screening Pack Configs Without Building a Single Pack
This is where a digital twin earns its keep for a small team. Before committing to a build, we screen candidates virtually:
- Series count (4S vs 6S vs 8S) at equal pack energy — higher series lowers per-cell current (good for sag) but raises ESC KV and motor demands and adds balance-wire weight.
- Parallel count (1P vs 2P) — doubling parallel halves per-cell current, so a 1300 mAh 1P that sags to 18.0 V becomes a 2600 mAh 2P holding 19.1 V under the identical trace, at the cost of about +85 g.
- Cell grade — a tighter DCIR spread (CoV under 6%) raises the usable floor by ~0.3 V because the weakest series cell no longer caps the whole string.
We run every variant through the same lap replay and rank by “minimum terminal voltage vs gate margin.” It turns a week of bench builds into an afternoon of simulation. Every configuration we ship as a custom battery solution is first proven in the twin, which is also why our customers receive packs with a documented performance envelope rather than a hopeful label.
Closing the Loop With Race-Day Telemetry
A model is only as good as its last calibration. After each event we pull the onboard telemetry — terminal voltage, per-cell temperature, current — and compare it against the twin’s prediction. On a fresh pack the mismatch is typically under 2% in voltage and under 1.5°C in temperature, which confirms the R(T) fit is sound. Where we see drift (usually after 40+ cycles as DCIR creeps upward) we re-extract R0 at the next bench session and update the parameter file. Over a 60-cycle season the model’s DCIR prediction tracks the measured value within 4%, which is plenty to keep our go/no-go gate honest. The twin becomes a living record of each pack’s health, not a one-time artifact — and that record feeds directly back into the next drone battery we design.
Frequently Asked Questions
How accurate is a racing drone battery digital twin?
For a fresh pack our electro-thermal twin predicts terminal voltage within about 2% and cell temperature within 1.5°C across a full qualifying lap. Over a 60-cycle season, DCIR prediction stays within 4% of measured values. That accuracy is more than enough to set a reliable voltage gate and to choose between pack configurations before building them.
Do I need expensive lab equipment to build one?
No. The entire parameter set comes from a bench cycler running a slow discharge plus one HPPC pulse sequence at three temperatures — roughly 30 minutes of lab time. The model itself runs on a laptop in seconds. The discipline matters more than the hardware: measure your own cells instead of trusting the printed C-rating.
Can the model predict pack temperature during a race?
Yes. The temperature-dependent resistance terms (R(T)) couple electrical loss to heat, so the twin outputs a per-cell temperature trace alongside voltage. We use it to confirm that no cell crosses our 55°C warning or 65°C hard-limit line during a hot qualifying run, which protects both performance and UN 38.3 / IEC 62133-2 safety margins.
How often should I recalibrate the model?
Re-extract R0 at every 40-cycle checkpoint, or whenever you see a pack’s measured sag drift more than 4% from prediction. For a race season that means roughly three calibration touches per pack — cheap insurance against a brown-out on lap four.
Does this approach work for non-racing drone batteries?
Absolutely. The same equivalent-circuit framework applies to inspection, mapping and delivery airframes; the only change is the current profile you feed in. We tune the lap replay for each airframe class, and for racing drones specifically the bursty 100–200 A punch-outs are what stress the twin hardest. We use identical twins across the lithium battery range at Horizon Power, and the same replay-and-screen workflow is the basis of every custom battery solution we deliver for racing drones and beyond.