Drone Battery Reliability for Mapping UAVs: Engineering (2)
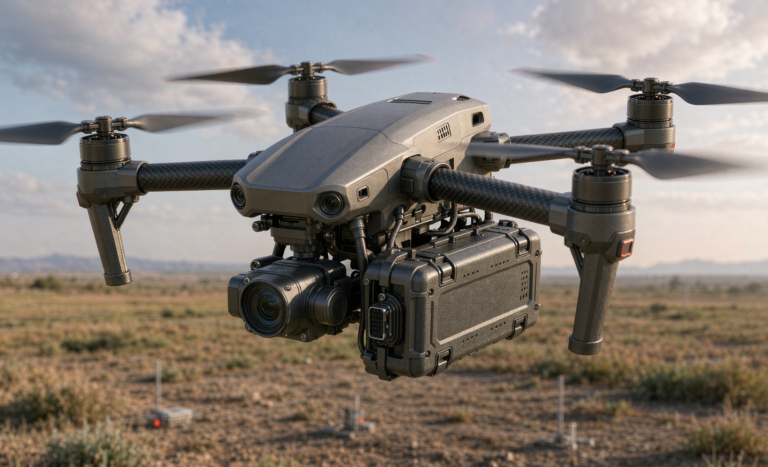
When I started designing power systems for mapping UAVs a decade ago, almost every survey flight was a visual-line-of-sight hop of eight to twelve minutes. If a cell sagged or a connector heated up, the pilot landed, swapped the pack, and the data gap was a few acres. Today my team at Horizon Power ships drone battery packs that fly ninety-minute beyond-visual-line-of-sight (BVLOS) corridor-mapping missions over pipelines, railways, and coastlines. The same chemistry that was “good enough” for a backyard quadcopter is now a single point of failure over hostile terrain with no pilot in sight — and that changes how I engineer drone battery reliability from the ground up.
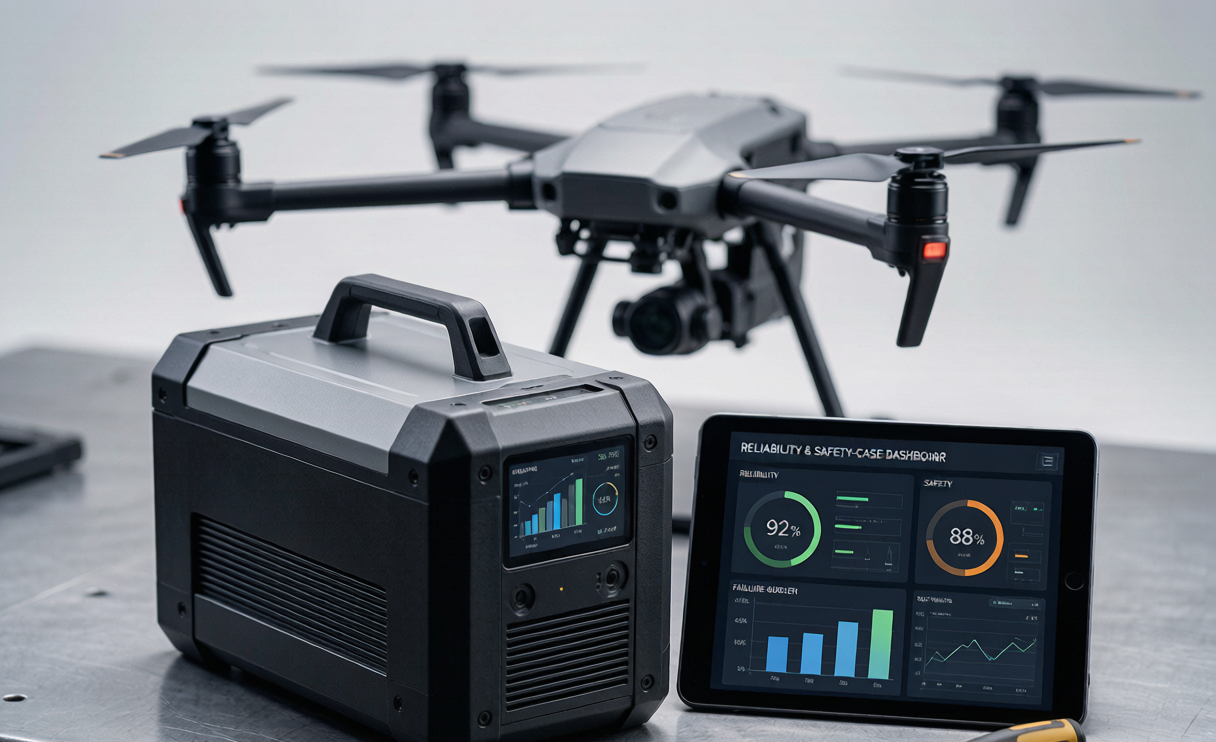
In this article I want to walk through the way we translate a regulatory safety case into concrete battery-design margins, and how we prove the pack can actually meet it. This is the lens I wish more operators understood before they spec a drone lithium battery for long-range survey work. The physics has not changed, but the consequences of getting it wrong have.
Why BVLOS Mapping Rewrites the Battery Reliability Equation
The first thing a BVLOS mission does is remove the recovery option. A twelve-minute VLOS flight over a field can be aborted to a soft landing in two seconds; a ninety-minute BVLOS rail-mapping pass over a mountain corridor has no such luxury. The energy requirement scales roughly nine-fold, but the consequence of a battery fault scales far more than nine-fold because there is no mid-mission recovery and no pilot eyeball on the airframe.
The second shift is regulatory. Under EASA SORA and FAA Part 107 waiver frameworks, a propulsion-loss event over a populated or critical corridor is treated as a “catastrophic” or “major” hazard, and the operator must demonstrate a quantified failure probability — not a vague “it’s reliable.” A 90-minute BVLOS mission logging three kilometres of track per flight is a high-value data capture, but if the lithium battery faults, the airframe, the payload, and the survey window are all lost at once.
Here is the arithmetic I show operators. If a fleet flies 200 BVLOS missions per month and the battery carries a 1-in-1,000 per-flight fault probability, that is 0.2 failures per month, roughly 2.4 per year — each potentially a lost airframe plus a regulatory incident report. To stay inside a “major” SORA tier, the critical-battery fault tree usually has to beat 1×10⁻⁵ per flight hour. That single number drives every design decision that follows, and it is why a catalog pack with only an MTBF sheet is never sufficient for this class of work.
From a Safety-Case Target to a Battery Failure Budget
A safety-case target like 1×10⁻⁵ per flight hour over a 1.5-hour mission becomes a 1.5×10⁻⁵ per-mission budget. The engineering job is to allocate that budget across the real energy chain, because a pack is not one component — it is cells, welds, busbars, a BMS, connectors, and a thermal path in series. I model the pack as a reliability block diagram: the pack is a series chain of n series groups, and each group is a parallel set of m cells, so R_pack is the product of every link’s reliability.
For a typical 6S3P 21700 mapping module I split the 1.5×10⁻⁵ budget roughly as: cells 4×10⁻⁴, weld and busbar joints 4×10⁻⁴, BMS and monitoring 4×10⁻⁴, connectors and harness 3×10⁻⁴. Each slice turns into a hard design rule. The cell slice means incoming screening with DCIR coefficient of variation below 6% and a self-discharge K-value under 1.0 mV/day. The weld slice means acceptance at under 0.15 mΩ per joint and a 25 N pull test. The BMS slice means two independent monitoring channels with a fault gate under 200 ms. The connector slice means derating to 50% of the rated current so the link never runs hot in cruise.
None of this is meaningful unless the cells and pack already clear the baseline safety certifications. UN 38.3 T.1–T.8 and IEC 62133-2 are the floor we design on top of — they prove the pack will not vent or ignite under transport and abuse, which is a prerequisite before any reliability allocation is even worth discussing.
Margins and Derating That Actually Buy Reliability
Once the budget is allocated, the cheapest reliability you can buy is margin, and the cheapest margin is in how you operate the cells rather than in adding hardware. I keep three operating rules on every BVLOS survey pack.
First, voltage headroom. We cap a 6S pack at 4.10–4.15 V per cell instead of pushing 4.20 V or 4.35 V LiHV. That single choice reduces lithium plating and swelling, and it leaves the top 5% of state-of-charge as a reserve the BMS can spend during an unexpected headwind rather than hitting a hard cutoff. Second, the SoC window. Survey packs run 20–90% rather than 5–100%. Cutting the top and bottom stress bands roughly halves the calendar and cycle fade that drives end-of-life drift, and it keeps the pack inside its flat-voltage plateau where the drone battery delivers predictable power.
Third, temperature and current derating. Continuous discharge is capped at −10 °C and +45 °C case temperature, and above 45 °C we reduce the C-rate by about 10% per 5 °C. A cold cell does not just lose capacity — at −10 °C a lithium battery cell can shed around 20% of its available capacity, but the real killer is the impedance rise that causes voltage sag, an early BMS low-voltage cutoff, and a premature mission abort. That is a “soft” failure, and it counts against reliability exactly as much as a hard one. We size the pack so nominal cruise current stays at or below 50% of the cell’s 30-second pulse rating; a 6S 21700 pack at 3P rated 20 A continuous per cell gives 60 A, while a rail-mapping cruise of 8–12 A leaves enormous headroom, low heat, and slow DCIR growth.
Architecture: Trading Mass for Fault Tolerance
There are two ways to hit a tight reliability budget. Path A is brute-force margin — over-spec the cells and add huge headroom. It is simple but heavy, and mass directly costs endurance, which is the whole point of a long-range mapping mission. Path B is graceful-degradation architecture: per-series-group isolation MOSFETs, or two independent battery buses with ideal-diode ORing, so a single fault degrades the pack instead of destroying it.
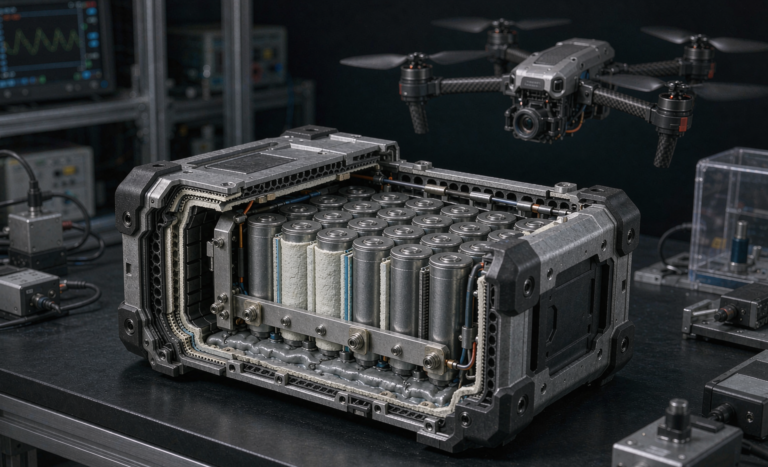
I worked the mass trade on a fault-tolerant 6S3P 21700 module. Adding isolation FETs, a second BMS monitoring channel, and a redundant harness costs about 8% pack mass. But it converts a “catastrophic loss” into a “limp-home” — in a 90-minute BVLOS mission that is the difference between recovering the airframe and the survey data versus writing off both. For mapping I tighten the rule I use on inspection packs: the second monitor is dissimilar redundancy, so a single BMS firmware fault cannot take down both channels at once.
The decision rule is straightforward. If the mission has no safe recovery site within glide range — typical for pipeline and coastline surveys — architecture B is mandatory. If there is a known landing strip every two kilometres, margin-only design may satisfy the budget at lower cost. The reliability target, not the catalog, decides.
Verifying the Reliability Claim With Evidence
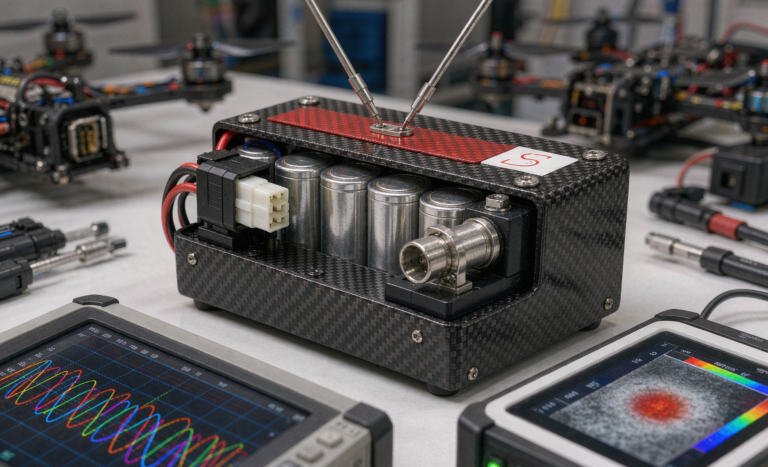
A 1×10⁻ claim with no evidence is just a number on a slide. Our verification stack is what turns the budget into something an operator’s safety manager will sign. First, accelerated life testing: we replay logged BVLOS current profiles on a cycler, apply Arrhenius temperature acceleration capped below 55 °C so we do not distort the failure mode, sample at least twelve packs across two cell lots, and keep full genealogy. Second, fault-injection on the bench: we deliberately kill a cell group and confirm isolation engages in under 200 ms with limp mode active, and that no thermal propagation occurs thanks to a mica barrier that costs under 3 g.
Third, HALT combined-environment testing — random vibration per a MIL-STD-810H Method 514.8 tailoring plus thermal cycling — to find the knee where welds and busbars fatigue, and we qualify at 1.2× the flight grms. Fourth, fleet telemetry correlation: we log per-group voltage, temperature, and DCIR at 10 Hz, and we tie pre-flight warning signatures — DCIR creep above 0.4 mΩ per 20 cycles, parallel-group capacity divergence above 4% — back to in-service failures. That closes the loop: packs get retired before they breach the budget, not after.
The certification evidence package ties it together: test reports mapped to the SORA Specific Assurance and Contingency elements, the UN 38.3 and IEC 62133-2 certificates, DataMatrix genealogy for traceability, and a written maintenance and retirement gate. That package is what the regulator and the operator actually read.
Turning the Reliability Case Into a custom battery solution
The lesson I keep relearning is that we do not sell “a battery” — we deliver a packaged reliability argument. For a BVLOS mapping operator we specify a 6S topology with NMC 21700 cells grade-matched to a DCIR coefficient of variation below 6%, a two-tier BMS with independent dual monitoring and per-group isolation, an IP67 enclosure, an operating window of 20–90% SoC between −10 and +45 °C, 10 Hz telemetry export, DataMatrix genealogy, and a written retirement gate. That is a custom battery solution built around the operator’s specific SORA tier and mission profile, not a part pulled off a shelf — and it is the only honest way to stand behind drone battery reliability when the aircraft is ninety minutes from any help.
Frequently Asked Questions
What reliability level does a BVLOS mapping drone battery actually need?
It is set by the safety case, not by the cell datasheet. Under EASA SORA or an FAA Part 107 waiver, a catastrophic propulsion-loss event over a critical corridor often has to beat roughly 1×10⁻⁵ per flight hour. We convert that into a per-mission budget and allocate it across cells, joints, BMS, and connectors — each slice becomes a measurable design rule rather than a hope.
How is a battery failure budget different from a normal MTBF spec?
MTBF is a single average number that hides where the failures come from. A failure budget breaks the pack into its series links and assigns each a quantitative probability, so you can see that the weld joints or the BMS channel — not the cells — may be the weak link, and you can fix the right thing.
Does adding redundancy always improve drone battery reliability for mapping?
No. Redundancy like dual monitoring or per-group isolation buys fault tolerance, but it adds about 8% mass and complexity, which can hurt endurance and introduce its own common-cause risks if the two channels are not dissimilar. For missions with a safe recovery site nearby, margin-only design is often the better trade; for true BVLOS with no landing option, the architecture is worth the mass.
Which standards apply to these mapping UAV battery packs?
The safety floor is UN 38.3 T.1–T.8 for transport and IEC 62133-2 for cell and pack safety, with IATA Section II for sub-100 Wh packs. For the operation itself, EASA SORA and FAA Part 107 waiver frameworks define the reliability target, and we map our test evidence to those requirements. None of the reliability work matters until those baseline certifications are cleared.
How do you verify the pack meets its reliability target without flying thousands of missions?
We use accelerated life testing with replayed mission current profiles, fault-injection benches that confirm sub-200 ms isolation, HALT combined-environment testing to find joint-fatigue knees, and fleet telemetry correlation that retires packs before they breach the budget. Together these give the statistical and physical evidence a safety manager needs without waiting for real-world failures.