Home Energy Storage Monitoring Apps and Data Tracking
I have commissioned several hundred residential systems, and I can tell you exactly which phone call I get most often. It is not about capacity, and it is rarely about chemistry. It is a homeowner saying: “The app said 100% this morning, and the lights still went out at 6 p.m.” Nine times out of ten the battery is fine. The number on the screen was wrong, or it was answering a question the homeowner did not actually ask.
A home energy storage monitoring app is the only part of the system the owner touches every day, so it carries a weight out of proportion to its cost. It also decides whether you catch a failing cell in week three or discover it in year six when the warranty has thinned out. This is the checklist I use when evaluating a monitoring stack: which data channels matter, what sampling rates and tolerances are honest, and how to keep the logbook a warranty claim actually needs.
What a Monitoring App Should Actually Show You
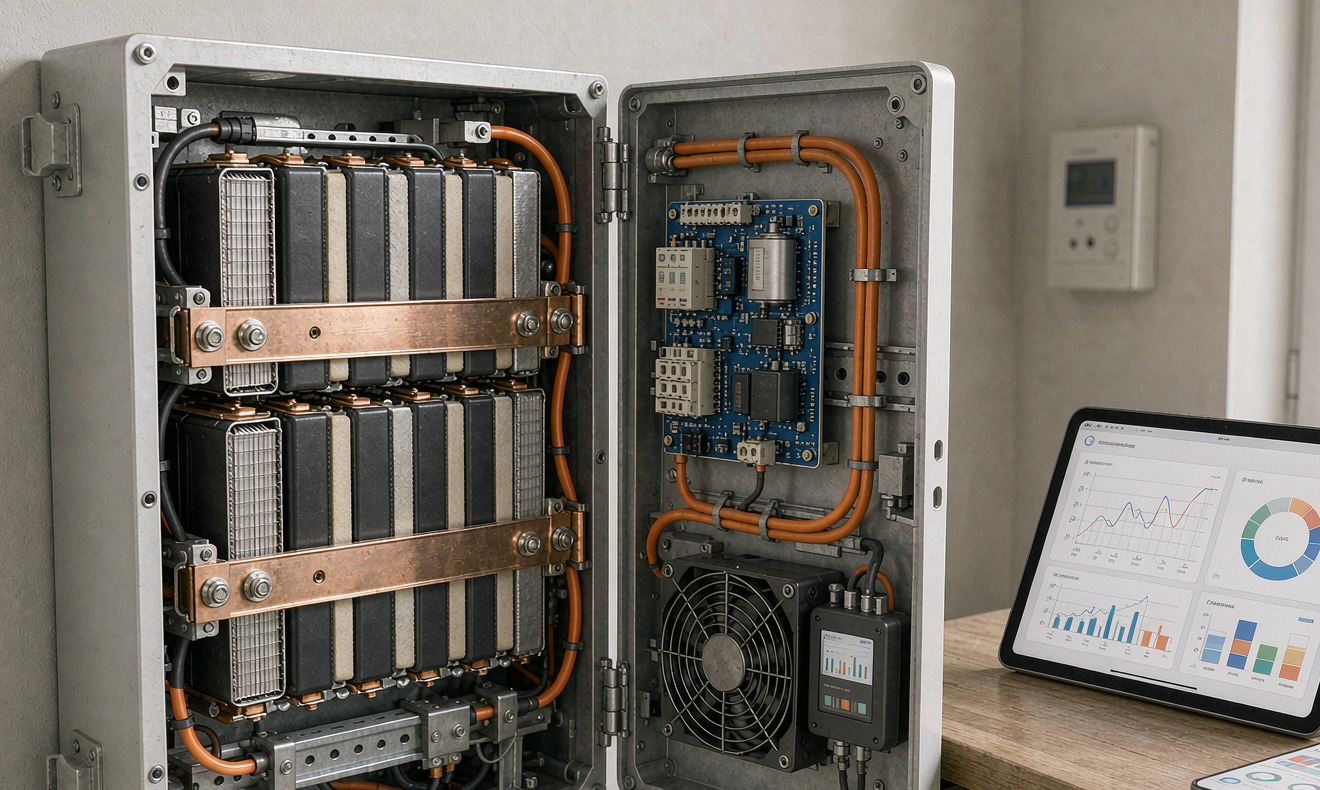
Most consumer apps show four tiles: state of charge, solar production, house load and grid exchange. Fine for a screenshot, almost useless for engineering. A useful home energy storage system dashboard exposes three layers, and I check for all three before signing off a commissioning.
- Cell layer: individual cell voltages (millivolt resolution), at least three temperature probe readings, balancing status, and the min/max cell delta.
- Pack layer: terminal voltage, current with sign, charge and discharge energy totals, insulation resistance, contactor and pre-charge state, DC internal resistance estimate.
- Site layer: grid import/export, PV array output, house consumption, generator or backup panel state, and any load-shed relay status.
If the app hides the cell layer behind a “service mode” login, I treat that as a negative. The cell delta is the earliest indicator of a real problem in a lithium battery pack, and the owner paying for a 10-year asset should see it. I ask vendors for end-user read-only access to cell voltages and temperatures; refusal usually means the pack is marginal.
I also insist on an event log with timestamps. A fault that clears itself leaves no trace in a status screen, and over a decade the log is what lets you correlate a trip with a storm, a utility event, or a firmware update.
Sampling Rate and Resolution: Where Cheap Systems Lie
This is the most common place a spec sheet misleads. A vendor advertises “1-second data” because the gateway polls the inverter every second, but the app then aggregates to 5-minute averages and the cloud stores 15-minute buckets. What you see is not what was measured. Here is the resolution I consider adequate:
- Cell voltage: 1 mV resolution, ±5 mV accuracy, 1 Hz.
- Pack current: sampled internally at 1 kHz or faster for protection, reported as 1 Hz averages with 10 Hz peaks retained.
- Temperature: 10 Hz, 0.5 °C resolution, ±1 °C across 0–60 °C.
- Site power (grid/PV/load): 1 Hz, 10 W resolution on a 10 kW service.
Why does 1-second data matter if the app shows 5-minute bars? Because peaks hide in the gaps. A 4.5 kW water heater element or a well pump drawing 2.2 kW for 90 seconds becomes a gentle slope when averaged over five minutes. When I evaluate whether an inverter is nuisance-tripping on overload, I need the peak, and a five-minute average discards it. Ask whether raw 1-second data is downloadable as CSV.
There is a hardware limit worth knowing: most residential energy meters report at 1 Hz over Modbus RTU at 9600 or 19200 baud, so a gateway polling six devices on one RS-485 bus is already near the ceiling. Vendors claiming 100 ms site-level resolution are interpolating, not measuring.
State of Charge Is an Estimate, Not a Measurement
You cannot measure state of charge. You infer it. Every home battery does this with some blend of coulomb counting and open-circuit voltage correction, and every method drifts.
Coulomb counting integrates current over time, and small sensor biases compound because residential loads are long and shallow. A system with no recalibration event typically drifts 3–8 % over a few weeks of partial-state operation. That is exactly the failure mode behind “the app said 100 % and the lights went out” — the pack was really at 92 %, and the last few percent sat below the discharge cut-off anyway.
The correction comes from open-circuit voltage, which for LFP is notoriously flat. Between roughly 20 % and 90 % SOC an LFP cell’s OCV moves only a few tens of millivolts, far less than the ±5 mV measurement error, so recalibration only works near the knees. I recommend a full charge and a 2–4 hour rest monthly; a well-implemented estimator then lands within 3 %.
Practical advice: treat SOC as accurate to about ±5 % in daily use and set backup reserve at 20 %, not 10 %. I have never had a callback for an unexpected shutdown from a system configured that way.
Round-Trip Efficiency: How to Measure It Honestly
Vendors quote round-trip efficiency anywhere from 88 % to 95 %. Both numbers can be true, because they are measured at different boundaries.
- DC-DC (cell to cell): 95–97 % for a modern LFP pack with a good BMS.
- AC-coupled (grid AC in, grid AC out): 85–88 % — you pay for a rectifier on the way in and an inverter on the way out, roughly 6–7 % each way plus standby.
- DC-coupled (PV DC in, house AC out): 92–95 % — only one conversion stage.
The honest field measurement takes energy in and energy out at the same boundary over a long window. My protocol: run 30 consecutive days, pull cumulative charge and discharge energy from the app, divide, then sanity-check against the utility meter. If the app says 6 % round-trip loss but the bill disagrees, a current sensor is miscalibrated or a CT is on backwards.
Never measure over a single cycle — standby dominates short tests. A system drawing 45 W idle that cycles 8 kWh overnight loses about 0.5 kWh to standby alone, roughly 6 % of throughput with zero cycling loss.
How accurate is the state of charge reading on a home battery app?
In daily partial-state operation, expect ±5 %. The estimate is coulomb-counted and drifts 3–8 % over weeks without a full-charge recalibration; after a full charge and a 2–4 hour rest, a good estimator lands within 3 %. LFP’s flat open-circuit voltage curve between 20 % and 90 % SOC is the root cause — there is not enough voltage signal to correct against. Set backup reserve at 20 %, not 10 %, and the error stops mattering.
Cycle Counting, Equivalent Full Cycles and Warranty Evidence
Warranties are written in cycles, and cycles are counted in the software — which means the app is a legal document. Understand how the number is produced before you sign.
Equivalent full cycles (EFC) is the honest metric: total amp-hours throughput divided by twice the nominal capacity. A 10 kWh pack cycling 5 kWh daily accrues 0.5 EFC per day, not one. Vendors who count any discharge event as a full cycle can burn a 6,000-cycle warranty in 2,000 real cycles, legally. Read that clause.
For LFP in a well-managed home pack: 4,000–6,000 equivalent full cycles to 80 % capacity at 25 °C, 3,500–4,000 at 35 °C, under 2,000 at 45 °C. Calendar aging runs alongside at roughly 1.5–2.5 % per year at 25 °C and 50 % SOC, doubling to 3–4 % at 35 °C. A pack held at 100 % SOC in a 40 °C garage can lose 9–11 % in one year without a single deep cycle.
That is why retention matters. A warranty claim needs cumulative throughput, EFC count, and time-at-temperature and time-at-SOC records. If the portal keeps 90 days and the gateway seven, the evidence is gone. Insist on exportable lifetime logs and download them quarterly.
Alarms Worth Enabling (and the Ones That Cry Wolf)
Default alarm settings are tuned to avoid annoying the owner, which means they fire late. These are the thresholds I set on every commissioning.
- Cell delta above 30 mV after a 2-hour rest: warn. Above 50 mV: investigate now. A new pack should sit under 15 mV. A growing delta under load with a normal resting delta points to a high-resistance connection, not a bad cell.
- Cell temperature above 45 °C: warn; 55 °C: stop charge. Sustained operation above 45 °C is where cycle life collapses.
- Insulation resistance below 1 MΩ: do not energize. A healthy pack reads above 100 MΩ at 500 V. Values between 1 and 10 MΩ usually mean moisture in an enclosure, often from a missing or saturated breather vent.
- Charge attempt below 0 °C: hard lockout. Charging a lithium cell below freezing plates metallic lithium on the anode. This is the one interlock I test on the bench, every time, because a software-only lockout that ships disabled is a fire risk.
- DC internal resistance up 25–30 % from commissioning baseline: early warning. Resistance growth typically precedes the capacity knee by 300–500 cycles, so this is your lead time to plan a replacement rather than react to one.
The ones I turn down: transient over-current alerts on motor starts, which fire on every well pump and teach the owner to ignore the app, and any grid-voltage alarm set tighter than the inverter’s own ride-through. An alarm that fires weekly gets muted.
Local Access, APIs and Data Ownership
Every monitoring stack faces the same question: does the app work when the internet does not? For a backup battery that is not philosophical — the grid failure you bought it for is exactly when the cloud link is least reliable.
I require three things. A LAN dashboard reachable by IP with no cloud round trip (200–500 ms, not the 5–30 s of a remote server). A documented local API — in practice Modbus TCP with SunSpec register maps (models 1, 101, 124 and 802 cover the common inverter and battery parameters), an MQTT broker, or a REST endpoint. And the ability to run indefinitely with the vendor’s cloud shut down.
The control loop must never depend on the network. Protection decisions — contactor opening, charge lockout, thermal derating — happen in the BMS in under 5 ms. The app is a display and historian; any architecture where it can command a contactor over the public internet is one I will not commission. For utility programs, prefer IEEE 2030.5 or OpenADR 2.0b over a proprietary cloud hook.
Cybersecurity and Network Hygiene for a Battery App
A battery is a grid-connected actuator with several kilowatts behind it and, in many markets, a revenue stream attached. Treat the network path accordingly.
Minimum hygiene I apply: a dedicated VLAN with no inbound ports from the internet; UPnP disabled; unique local admin credential; TLS 1.2 or later for anything leaving the premises; remote vendor access off except for explicit, time-limited support sessions. If a permanent always-on tunnel is a warranty condition, get it in writing and ask what happens when their certificate expires in year eight.
Firmware is the harder problem. Ask whether updates are signed, whether there is a documented rollback, and whether the vendor publishes a CVE contact. A 10-year warranty on hardware whose software stops receiving patches in year three is a real risk.
Using Your Data: Four Reports I Run Every Quarter
Collecting data is easy; reading it is the skill. These four checks take under ten minutes each with a CSV export.
- Capacity trend. Compare amp-hours delivered on the three deepest discharges each quarter against commissioning. A steady 1–2 % per year is calendar aging; a sudden 8 % drop means a cell or connection has failed.
- Time-at-temperature histogram. Count hours above 35 °C and 45 °C. A pack that spent 1,900 hours above 40 °C has roughly half the remaining life the datasheet implies, and no warranty will cover it.
- Depth-of-discharge distribution. If 80 % of cycles are under 20 % depth the pack is oversized and you paid for capacity you are not cycling. If 60 % exceed 90 % depth, it is undersized and aging fast.
- Self-consumption ratio. PV consumed on site divided by PV generated. Below 40 % usually means the battery charges too early or the reserve is too high — a settings change, not a hardware purchase.
The point is argument-proof decisions. When an owner asks whether to add a second battery, the depth distribution answers it in one chart. When a warranty claim is filed, the temperature histogram is the evidence.
Commissioning Checklist: Verify the App Against a Meter
Never accept the app’s numbers on day one. I bring a calibrated clamp meter and a reference multimeter to every commissioning and reconcile the following.
- Consumption CT placement and direction. The CT must clamp the utility service conductors upstream of any PV or battery connection; reversed arrows make house load go negative when the sun is out. Compare against the revenue meter for 15 minutes with a known 2–3 kW load running.
- Pack voltage. Multimeter at the terminals versus app reading; agreement within 0.5 %.
- Current sign convention. Force a known discharge and confirm the display matches its own legend. I have found portals where charge and discharge were swapped.
- Resting cell delta. Full charge, two-hour rest: under 15 mV on a new pack.
- Insulation resistance. Above 100 MΩ at 500 V. Below 10 MΩ, do not energize — find the moisture path.
- Low-temperature lockout. Bench-verify that a charge request below 0 °C is refused. This is the one interlock I will not take on trust.
Then record the baseline: capacity at 0.2C, DC internal resistance at 1 kHz, resting cell delta, firmware versions. Every later health judgment is a comparison against it.
Standards That Govern the Data Itself
Monitoring is not unregulated, though the requirements are scattered. For the hardware, IEC 62619 covers stationary lithium battery safety and IEC 62133-2 addresses cells and packs; UN38.3 governs transport at no more than 30 % SOC. UL 9540 and UL 9540A cover system-level and thermal runaway propagation testing, with NFPA 855 and NEC 706 covering installation.
For the data layer, SunSpec Modbus defines the register maps that make multi-vendor monitoring possible, IEEE 2030.5 and OpenADR 2.0b handle utility signalling, and IEC 62443 is the security framework for what a gateway really is: an industrial control component. A vendor who can name the SunSpec models their gateway implements will almost certainly have a usable API. One who cannot usually has a walled garden.
FAQ
What data should a home energy storage monitoring app show?
Three layers: cell-level voltages, temperatures and min/max delta; pack-level voltage, current, energy totals and insulation resistance; and site-level grid, PV and load power. If the app only shows state of charge, solar production and house consumption, it is a marketing display, not a diagnostic tool. Insist on read-only cell access — the cell delta is the earliest warning of a real fault.
Why does my battery app show 100% but the backup still fails?
Because state of charge is an estimate that drifts 3–8 % over weeks of partial cycling, and the last few percent of indicated charge sits below the usable discharge window. LFP’s flat voltage curve prevents reliable correction except near full or empty. Fix it by charging to 100 % and resting 2–4 hours monthly, and by setting backup reserve at 20 % rather than 10 %.
How often should I export my battery data?
Quarterly for your own trending, annually for a permanent archive. Vendor clouds commonly retain only 30–90 days of granular data and some gateways hold just seven days locally. Cumulative energy, equivalent full cycles, time-at-temperature and time-at-SOC are the records that support a warranty claim, and once they are gone they cannot be reconstructed.
What is a normal cell voltage delta for a home LFP battery?
Under 15 mV after a full charge and a two-hour rest on a healthy new pack. Investigate above 30 mV; treat above 50 mV as a fault. A delta that opens under load but closes at rest usually indicates a high-resistance connection rather than a degraded cell — check torque before condemning a module.
Is 1-second monitoring data necessary, or is 5-minute enough?
One-second data is necessary if you ever intend to diagnose anything. Five-minute averaging hides short high-power events — a 4.5 kW water heater element or a 2.2 kW well pump becomes a smooth slope. Demand raw 1-second CSV export even if the app displays coarser bars.
Can I integrate my home battery into a third-party home automation system?
Often yes, via Modbus TCP with SunSpec register maps, MQTT or a documented REST API — but verify before purchase, because it is far from universal. A local integration gives 200–500 ms refresh and keeps working without internet. It should be read-only: contactor commands and protection logic belong in the BMS.
How do I know if my battery warranty is being consumed faster than expected?
Check how equivalent full cycles are counted. The fair definition is total amp-hours throughput divided by twice the nominal capacity. If the vendor counts any discharge event as a full cycle regardless of depth, a 6,000-cycle warranty can expire in 2,000 real cycles. Pull cumulative throughput from the app, compute the EFC yourself, and compare against the elapsed term.
What insulation resistance reading is safe for a home battery?
Above 100 MΩ measured at 500 V for a healthy new pack. Below 10 MΩ, do not energize — find the moisture path first, usually a missing, clogged or saturated breather vent. Readings between 1 and 10 MΩ in an installed system typically mean condensation rather than damaged cells, but must be resolved before returning to service.
Does the monitoring app keep working during a power outage?
BMS protection always works because it runs locally and independently. Whether the app works depends on design. A LAN-accessible dashboard keeps running on the battery’s own supply and is the only thing you can rely on during a blackout; cloud-only apps frequently fail then, because the router loses power or the internet drops with the grid.
Further Reading
References