Drone Battery Testing for Racing Drones: The Bench
I am Karl Huang, Senior lithium battery Engineer at Horizon Power. Over the past decade I have run somewhere north of 40,000 discharge cycles on our test benches, and a disproportionate share of them were on packs built for racing quads. Racing is the most brutal duty cycle in the industry: a 1300 mAh pack is asked to deliver 100 A or more in 80-millisecond bursts, sustain 30–50 A average, and finish a three-minute heat while its surface temperature climbs past 55 °C. Nothing hides in that environment. If a cell is 8% weaker than its siblings, the pilot feels it in the last lap.
This article is about how we actually test those packs — the instruments, the protocols, the pass/fail thresholds and the paperwork. It is not a list of specs to shop by. It is the bench discipline behind a spec sheet. Proper drone battery testing for racing drones is what separates a number printed on shrink wrap from a number you can fly on.
Why a Racing Pack Needs a Different Test Plan
Most drone battery test plans in circulation were written for survey and inspection aircraft: constant 3–8 A draw, 25-minute flights, thermal steady state reached within two minutes. A racing pack never reaches steady state. It lives entirely in the transient regime, and that changes what you must measure.
Three consequences follow directly:
- Sampling rate matters more than accuracy. A throttle punch out of a corner is a 50–150 ms event. A logger sampling at 1 Hz will report a comfortable 3.75 V/cell while the pack is actually collapsing to 3.35 V/cell during the punch. We sample at 1 kHz minimum on voltage and current channels.
- Average current is nearly meaningless. Two packs with identical 35 A average draw can differ by 0.25 V/cell at peak. Peak sag under a defined pulse is the number that predicts lap time.
- Cycle counts are short and steep. A high-C-rate lithium battery for racing typically reaches 80% state of health in 150–250 cycles, versus 500–800 for a moderate 10C industrial pack. Cycle testing must therefore replay a race profile, not a 1C textbook curve, or the answer is optimistic by a factor of two.
The Bench: Instruments, Accuracy and Fixturing
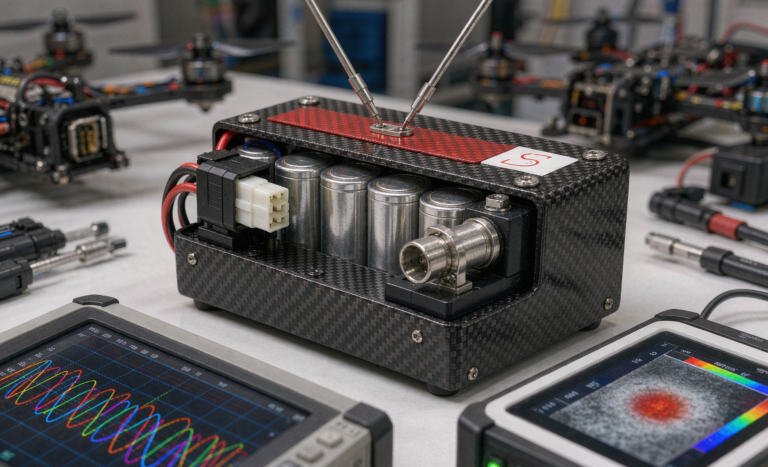
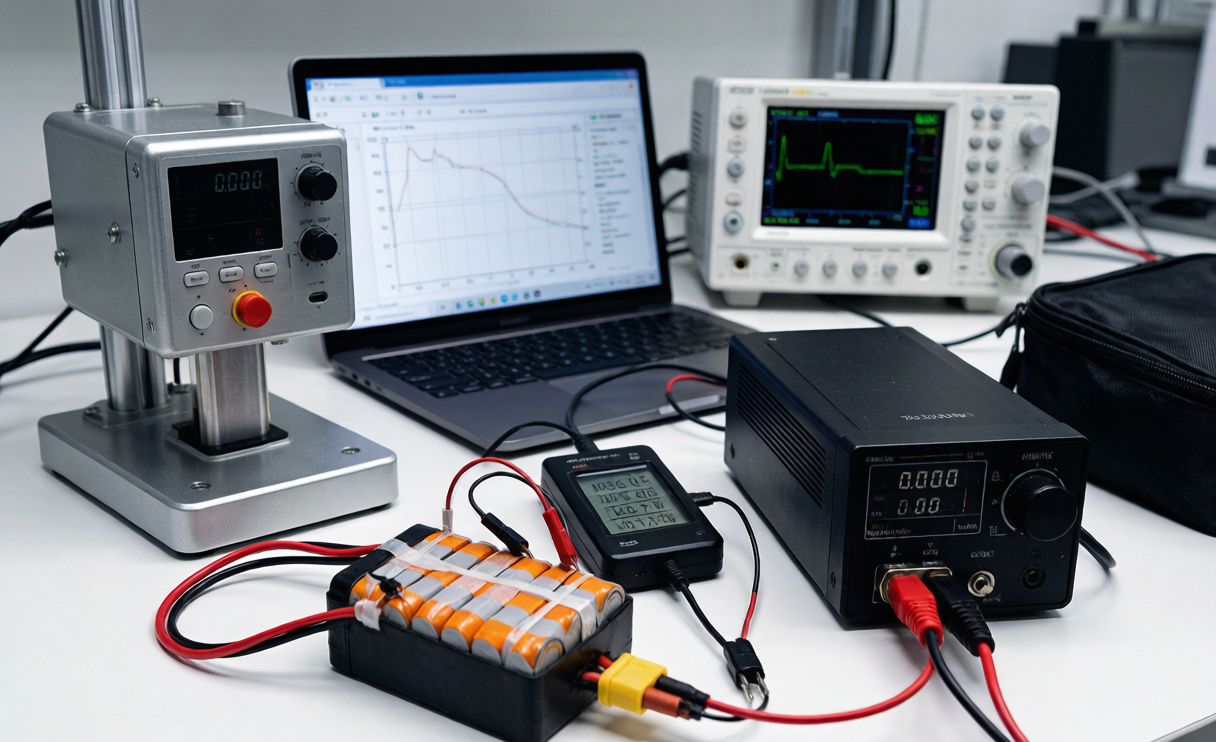
A test result is only as trustworthy as the fixture holding the pack. Our racing-pack bench is built around five elements.
Programmable electronic load. We use a load capable of 0–60 V with 500 A pulse capability and rise times under 1 ms, so the commanded pulse is genuinely a pulse and not a ramp. Current is verified against a calibrated shunt with ±0.1% class accuracy rather than trusting the load’s own readback.
Four-wire (Kelvin) voltage sensing. This is the single most common error I see in hobby and even in some factory data. At 120 A, 1.5 mΩ of cable and connector resistance eats 0.18 V. Sense leads must land on the pack terminals themselves, not on the load’s binding posts, or you are measuring your own wiring and calling it cell performance.
Thermal instrumentation. Type K thermocouples, class 1 (±1.5 °C), bonded to cell surfaces with polyimide tape at three positions: centre cell face, tab region, and pack edge. Tab temperature typically runs 8–15 °C hotter than the centre face, and internal cell temperature can be another 10 °C above the surface at end of a race discharge. Infrared spot readings alone are not acceptable for acceptance data; emissivity on shrink wrap is unreliable.
Internal resistance measurement, both ways. A 1 kHz AC milliohm meter gives a fast, repeatable number for incoming screening. But for a racing drone lithium battery we also run a DC pulse IR test (10 s at 10C, ΔV/ΔI), because that value is 20–40% higher than the AC figure and is the one that actually governs sag and heat.
Safety containment. Every abuse or overcharge test runs inside a vented steel enclosure with a fire blanket and no operator in the room during the event. We have had exactly two vent-with-flame incidents in ten years, both deliberate abuse tests, both uneventful because of the enclosure.
Incoming Cell Inspection and Matching
Pack quality is decided before assembly. Every cell lot entering our line is screened, and the tolerances we hold for racing builds are tighter than for general-purpose drone battery production:
- Open-circuit voltage spread within a matched set: ≤ 10 mV
- Measured 1C capacity: within 2% of nameplate, and within 1.5% of each other inside a pack
- DC pulse internal resistance spread: ≤ 5% across the set
- Mass tolerance: ±1.5 g per cell against lot median (a proxy for electrolyte fill consistency)
- Thickness after a full charge: recorded as a baseline for later swell tracking
The IR spread limit is the one customers underestimate. A pack whose cells differ by 15% in resistance will develop a 40–60 mV divergence under load, and after 60 cycles that divergence becomes a permanent capacity imbalance. Matching on capacity alone is not matching.
The Electrical Test Matrix
Our standard racing-pack matrix has five stages. Stages 1–3 run on 100% of packs for competition orders; stages 4–5 run on lot samples.
Stage 1 — Reference capacity. Full charge to 4.20 V/cell CC-CV (CV taper to C/20), rest 30 minutes, discharge at 1C to 3.30 V/cell. This gives the baseline watt-hours against which everything else is normalised.
Stage 2 — Pulse sag characterisation. From 100%, 80%, 50% and 30% depth of discharge, apply a 10 s pulse at 60C and record the minimum per-cell voltage. Our internal acceptance line for a competitive 6S pack is ≥ 3.40 V/cell under a 60C pulse at 50% DoD. Below 3.30 V/cell the pilot will hit ESC brownout protection on hard exits.
Stage 3 — Race profile emulation. We replay a logged throttle trace from a real 3-minute heat: roughly 15–95% duty cycle, 30–50 A average, 120–180 A peaks on a 1500 mAh 6S class pack. Metrics captured are useful energy above 3.50 V/cell, peak surface temperature, and end-of-run cell divergence. “Useful energy” is our preferred figure of merit — a pack can hold nominal capacity yet deliver 12% less energy in the voltage band where a quad actually produces thrust.
Stage 4 — Cycle life on the race profile. Repeat stage 3 with a controlled 30-minute cooldown between cycles until capacity falls below 80% of stage 1. We report the cycle number and the resistance growth curve, not just the endpoint. Typical results for our high-rate chemistry sit in the 180–240 cycle band; resistance growth of 35% is usually the practical retirement trigger before capacity fade is.
Stage 5 — Storage and recovery. 28 days at 3.85 V/cell storage voltage, 25 °C, then re-measure. Self-discharge above 3%/month or IR growth above 8% points at a sealing or electrolyte issue in the cell lot.
Thermal, Vibration and Environmental Testing
A racing airframe is a vibration source bolted to a battery mount. We qualify to recognised environmental standards rather than inventing our own shake profile:
- IEC 60068-2-6 sinusoidal vibration sweeps, 10–500 Hz, to confirm that tab welds, lead exits and strain reliefs survive resonance. Most racing-pack failures we autopsy are mechanical at the tab-to-lead joint, not electrochemical.
- IEC 60068-2-27 mechanical shock, half-sine pulses, representing crash impacts. A racing pack will be crashed; the design target is that a survivable crash does not produce an internal short.
- Thermal chamber discharge at 0 °C, 25 °C and 45 °C ambient. Cold performance is the underrated one: at 0 °C ambient a high-C pack can lose 20–30% of its pulse capability until self-heating brings cell temperature above roughly 20 °C. This is why experienced pilots warm packs before a heat, and why we publish cold-pulse data.
- Post-test dimensional check. Any cell showing more than 8% thickness growth against its charged baseline is treated as a failure regardless of electrical performance.
Safety and Compliance Testing
Performance testing is our own discipline; safety testing is a legal gate. For every cell and pack configuration we ship, the compliance chain is:
UN 38.3 (UN Manual of Tests and Criteria, Part III, sub-section 38.3) — the transport qualification. Tests T.1 altitude simulation (11.6 kPa, 6 h), T.2 thermal cycling (−40 °C to +75 °C), T.3 vibration, T.4 shock, T.5 external short circuit (≤ 0.1 Ω), T.6 impact/crush, T.7 overcharge, and T.8 forced discharge. No pack leaves without a valid UN 38.3 test summary; carriers and freight forwarders will demand it, and increasingly so will customs.
IEC 62133-2 — safety requirements for portable sealed secondary lithium cells and batteries. This covers continuous low-rate charging, external short, free fall, thermal abuse, overcharge and forced discharge with defined acceptance criteria.
Transport state of charge. Under IATA rules, lithium-ion cells and batteries shipped on their own (UN3480) must travel at no more than 30% of rated capacity. Packs shipped with or contained in equipment follow their own provisions. Terminals must be protected against short circuit in every case.
Passenger-carriage limits. FAA and EASA guidance is consistent on the practical point pilots care about: spare lithium batteries travel in carry-on only, up to 100 Wh without approval, and 100–160 Wh with airline approval. A 6S 1500 mAh pack is about 33 Wh, so a race kit of six packs is well inside limits — but each must be individually protected, and most airlines expect them in fire-resistant bags.
Production Acceptance and Sampling
Qualification testing proves a design. Acceptance testing proves the units in the box. The two are routinely confused, and the confusion is expensive.
For racing orders — low volume, high value, high consequence — we run 100% electrical screening: capacity, DC-IR, pulse sag at one DoD point, and a leak/insulation check. For higher-volume general drone battery lines we move to attribute sampling under ISO 2859-1 with tightened AQL on safety-relevant characteristics, backed by statistical process control on the critical parameters. Our internal requirement is Cpk ≥ 1.33 on capacity and IR; if a lot’s Cpk drops below that we hold the lot and investigate the cell supplier rather than sorting our way out of the problem.
Every pack carries a serial that resolves to its cell lot codes, welding parameters, matching data and test record. When a customer reports a field failure, I want to know within an hour whether the pack came from a lot we should be worried about. That traceability is also what makes a genuinely engineered custom battery solution auditable, rather than a bag of cells with a label on it.
Correlating Bench Data to Track Results
The final validation step is the one most labs skip: fly the thing. We instrument a test quad with a logging power module and compare bench predictions to reality.
Two correlations have held up consistently across our data:
- Pulse sag at 60C / 50% DoD tracks lap-time consistency better than any capacity or C-rating figure. Packs within 30 mV/cell of each other on this test produce lap times within roughly 1% of each other; packs differing by 150 mV/cell are visibly slower on exits.
- Useful energy above 3.50 V/cell predicts how many laps a pilot gets before the quad feels soft. Nameplate capacity does not, because the last 15% of a sagging pack is unusable thrust.
Bench-to-field correlation is also how we catch our own errors. Early on we chased a 4% capacity improvement that turned out to be entirely invisible in flight because it lived below 3.4 V/cell. That result changed what we optimise for, and it is why our datasheets now lead with sag and useful energy rather than headline C-ratings.
What a Test Report Should Actually Contain
If you are sourcing packs — for a race team, a fleet, or a product — ask for the report, not the claim. A credible drone battery test report contains:
- Instrument list with calibration dates and traceability
- Sampling rate and sense-lead configuration (if it does not say four-wire, assume it was not)
- Reference capacity method (charge profile, cutoff, rest time, temperature)
- Pulse sag data at defined C-rate and DoD points, per cell, not pack average
- Thermal data with thermocouple locations named
- Cycle-life protocol described well enough to reproduce, plus resistance growth curve
- UN 38.3 test summary reference and IEC 62133-2 status
- Lot traceability and the sampling plan or 100% screening statement
Any supplier can print “100C” on shrink wrap. Very few can hand you that list. When we develop a custom battery solution for a team or an OEM, the test protocol is negotiated at the start of the project alongside the electrical spec, because the protocol is what makes the spec enforceable.
Frequently Asked Questions
How can I test my own racing drone battery without a lab?
You can get useful data from a decent hobby charger plus an in-line logging power module. Charge fully, discharge at 1C to 3.3 V/cell for a real capacity figure, then fly a consistent throttle pattern and log minimum cell voltage under punches. What you will not get is defensible pulse sag data — hobby chargers cannot pull 60C, and without four-wire sensing your leads dominate the measurement. Treat home results as relative comparisons between packs, not absolute numbers.
How much voltage sag is acceptable on a racing pack?
Our internal acceptance line is ≥ 3.40 V/cell during a 10 s 60C pulse at 50% depth of discharge. Between 3.30 and 3.40 V/cell the pack is flyable but will feel soft on hard exits. Below 3.30 V/cell you risk ESC brownout and the pack is out of spec for competition use. Always compare sag figures at the same C-rate and the same state of charge; a sag number without those two qualifiers is not a specification.
How many cycles should a racing drone battery last?
On a genuine race duty cycle, expect 150–250 cycles to 80% state of health from high-rate chemistry, and treat 35% internal resistance growth as the practical retirement point — it usually arrives before the capacity limit does. Packs cycled gently, stored at 3.85 V/cell and never charged hot will land at the top of that range. Packs left fully charged in a hot car will not reach half of it.
Do I need UN 38.3 testing to ship racing packs internationally?
Yes. UN 38.3 is a transport requirement for lithium cells and batteries, not an optional quality badge, and air carriers will ask for the test summary. Shipments of standalone lithium-ion batteries under UN3480 must also travel at no more than 30% state of charge, with terminals protected and correct labelling. If a supplier cannot produce a UN 38.3 test summary, you have a compliance problem regardless of how the packs perform.
Is 100% testing necessary, or is sampling enough?
It depends on volume and consequence. For competition packs and small critical fleets we screen 100% — capacity, DC-IR and one pulse point — because a single weak cell ruins a race weekend and the unit cost of screening is small against the value. For higher-volume commercial lines, attribute sampling under ISO 2859-1 with process control and Cpk monitoring gives equivalent confidence at lower cost, provided the process is genuinely in control. What is not acceptable is sampling on a process nobody is monitoring.
Closing Note From the Bench
The uncomfortable truth about high-rate packs is that marketing numbers are largely unfalsifiable — there is no universally enforced method behind a printed C-rating. The defensible numbers are tied to a stated method: this current, this depth of discharge, this duration, this temperature, four-wire sensed, at this sample rate. That is why every lithium battery we build for racing carries a test record you can read, and why we are happy to write the protocol into the spec before a single cell is ordered.