Lithium Battery Cost Optimization Power Tools
I have spent the better part of a decade on the factory floor and in the cost-engineering office, and if there is one myth I want to kill it is this: that a cheaper power-tool battery is the one with the cheapest cell. After running the numbers on more than two dozen cordless platforms — 18 V, 36 V, even the 40 V max systems — I can tell you the cell is rarely where the money is won or lost. lithium battery cost optimization for power tools is a system problem: it is about the cost per usable cycle, not the sticker price of a 18650. In this piece I will walk you through the total-cost-of-ownership (TCO) model my team uses, the chemistry trade-offs that actually matter for tool packs, and the design and manufacturing levers that move the landed cost without quietly sacrificing the safety margins that UN38.3 and IEC 62133-2 demand.
If you run a tool brand, a private-label program, or a maintenance fleet, the framework below is the same one I use when a buyer hands me a target landed cost and asks how to hit it without a recall. The short version: stop optimizing the cell and start optimizing the cycle.
Why Power-Tool Battery Cost Is a System Problem, Not Just a Cell Price
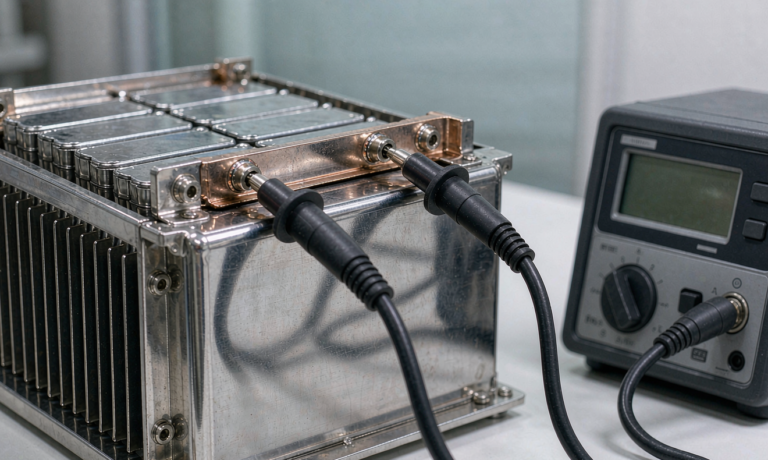
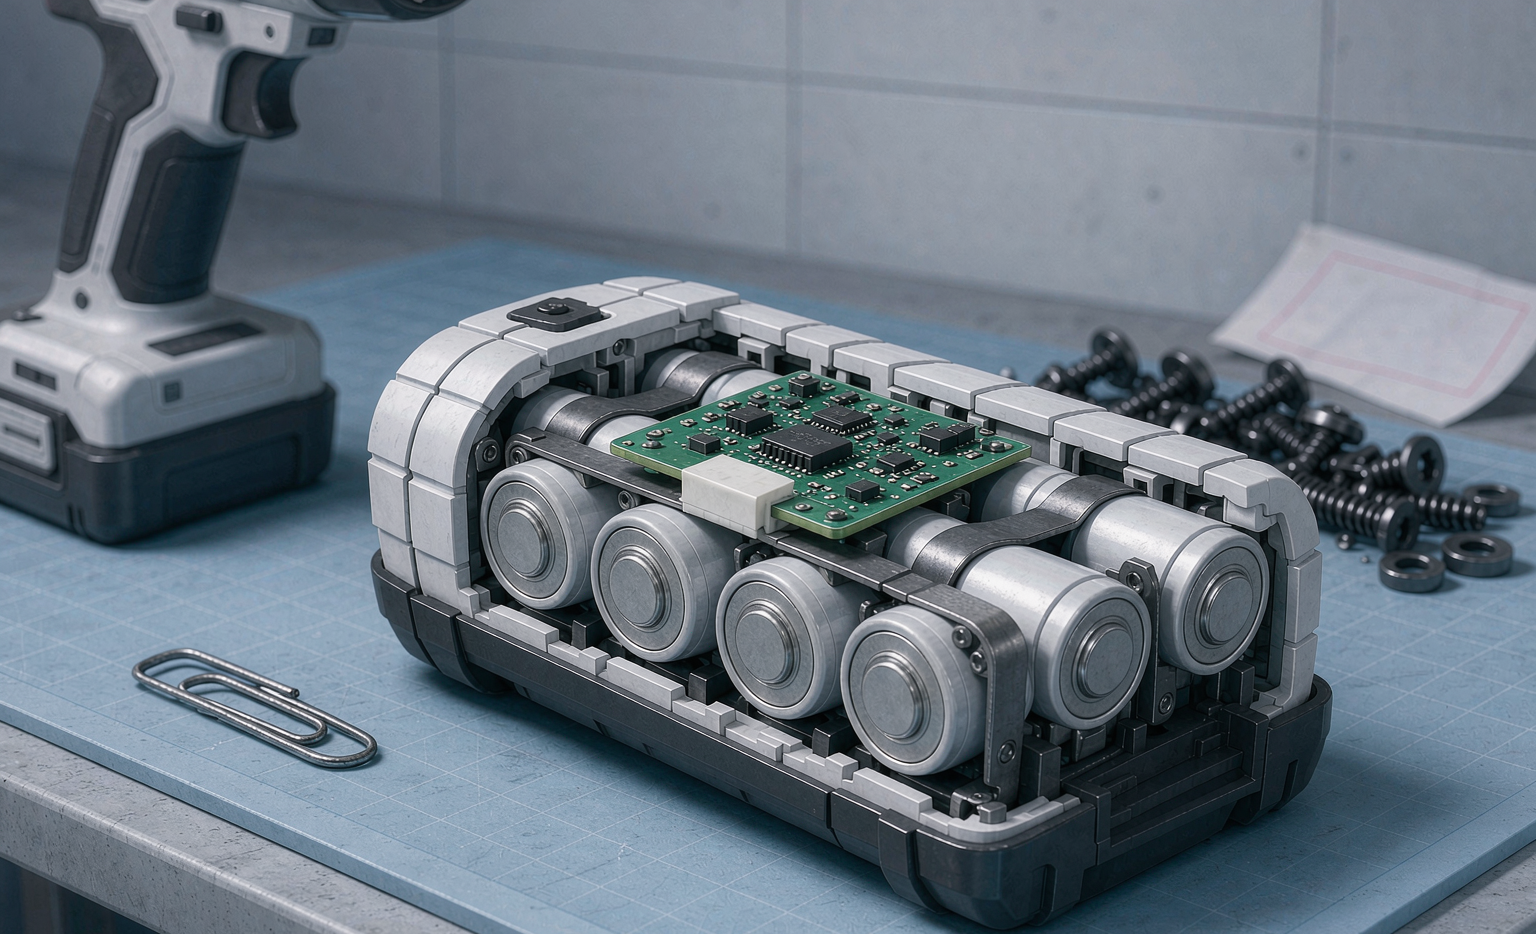
A cordless tool pack is roughly 70–82 % cell, 10–16 % electronics and protection, and 8–14 % mechanical housing, assembly, and labeling. But that headline split hides the real driver of cost: utilization. A 4.0 Ah pack that survives 300 hard cycles and one that survives 600 costs the same to build, yet the second one delivers half the $/cycle. When I scope a custom battery solution for a power-tool client, I model the duty cycle first — peak current, duty ratio, ambient temperature on the job site — because over-sizing the pack to feel “safe” is the single most expensive mistake I see. A pack built for 60 A continuous when the tool only ever draws 35 A is paying for cells it will never use.
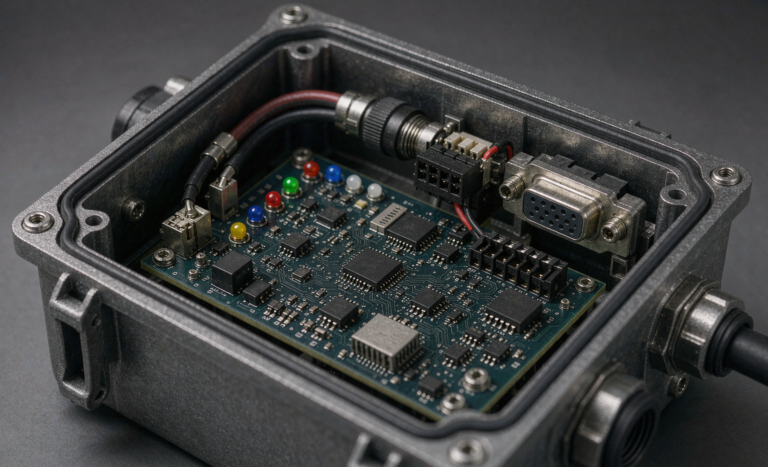
The other system effect is the protection and interconnect stack. Every nickel strip, every spot weld, every sense wire and balancing resistor adds cost and, more importantly, adds failure modes. The cheapest pack on paper is often the one that fails certification or field returns, and a single thermal event on a job site costs more than the entire margin on a thousand packs. So cost optimization has to respect the compliance floor: UN38.3 T.1–T.8 (the transport abuse battery of tests), IEC 62133-2 (secondary cells and batteries for portable applications), IEC 62619 for industrial-rated cells, and UL 2580 where the North American market requires it. I never let a cost target push a design below that floor.
The TCO Model — Breaking $/kWh Down to $/Cycle
Here is the model I put in front of every procurement team. Start with landed pack cost (LPC) in dollars. Divide by usable energy in kWh to get $/kWh, then divide again by the realistic cycle life at the actual depth-of-discharge the tool sees. For a typical 18 V 4.0 Ah tool pack, usable energy is about 0.072 kWh. If the landed cost is $22 and the pack delivers 400 real cycles to 80 % capacity, the cost per cycle is roughly $0.055. Push the design to 700 cycles through better cell grading and a smarter charge cutoff and the same $22 pack drops to $0.031 per cycle — a 44 % improvement with zero change to the bill of materials.
That is the leverage point. When a buyer says “can you get the pack under $19,” my first question is always “or can we get the $/cycle under $0.03?” because the second path usually produces a better product. I also fold in the warranty reserve — typically 3–6 % of landed cost set aside for field returns — and the second-life residual, because a tool pack retired at 80 % still has value as a backup or low-rate storage cell. Treat those two as credits and the effective $/cycle falls further. A good lithium battery program treats warranty and second-life as accounting line items, not afterthoughts.
Worked Example: The $22 Pack vs the $20 Pack
Two quotes land on my desk. Pack A is $20 with 300-cycle life; Pack B is $22 with 600-cycle life. Naively, A wins. On a $/cycle basis, A is $0.067 and B is $0.037. Over a 5,000-pack fleet, that is a $150,000 difference in usable energy delivered before replacement. I have made this exact call many times, and the lower-$/cycle pack almost always wins the TCO argument once the buyer sees the curve.
Chemistry on the Cost Curve — NMC vs LFP for Tool Packs
For power tools, the chemistry choice is the biggest single lever after utilization. NMC (nickel-manganese-cobalt) still dominates cordless tools because of its high specific energy — around 200–250 Wh/kg at the cell level — which keeps the pack light, and because it tolerates the high pulse currents tools demand (30–60 A is common in drills and impact drivers). LFP (lithium iron phosphate) has fallen in cell price to roughly $70–90/kWh versus $80–110/kWh for NMC, and it offers 2,000–4,000 cycles versus 300–500 for a hard-used tool pack. The catch is energy density: an LFP pack for the same Ah is about 20–30 % heavier and bulkier, which matters when the whole point of a cordless tool is that you hold it all day.
My rule of thumb: for high-current, weight-sensitive tools (impact drivers, reciprocating saws), NMC wins on pack mass even at a slightly higher $/kWh. For lower-current, always-on tools (lights, inflators, some lawn equipment) where cycle life dominates, LFP’s cost-per-cycle is compelling. The same weight-versus-cycle-life tension shows up in every portable pack I design, from a 2 kg impact driver to a multi-rotor drone battery where every gram is paid for in flight time. Either way, the cell purchase is only the start. I lock cell pricing with a fixed off-take or a multi-source agreement to avoid the cobalt and nickel exposure that swings NMC spot prices quarter to quarter. A custom battery solution that ignores commodity exposure is not optimized — it is just lucky for one quarter.
Design-for-Cost Pack Architecture
Once chemistry is fixed, the next savings come from parts count. Every unique component is a procurement line, a storage slot, and a point of assembly labor. I push clients toward:
- Fewer cell formats. Standardize on one 18650 or 21700 cell across the whole platform so you buy one cell in volume instead of three in dribs and drabs. Volume is the cleanest discount in this industry.
- Platform voltage families. Build 18 V and 36 V packs from the same cell by changing only the series count and the BMS firmware. Shared tooling and shared certification (IEC 62133-2 covers both) cut both unit cost and time-to-market.
- Integrated BMS. A single-board protection plus balancing solution with a成熟 (mature) fuel-gauge IC beats a discrete design on both cost and reliability. I budget the BMS at 8–14 % of pack cost and protect that line — cheaping out here is how you get field failures.
- Thermal simplification. Tool packs are air-cooled by default. Designing the enclosure so cells sit within 5 °C of each other without fans or heat pipes removes parts and failure modes. Passive cooling is free cooling.
The discipline that ties this together is constraint-driven design: I set the target $/cycle, then work backward to cell count, BMS features, and housing material. That is the opposite of the usual “design it, then cost it” flow, and it is the core of real lithium battery cost optimization for power tools.
Manufacturing Cost Levers That Actually Move the Number
On the line, three things move cost more than anything else. First, laser welding with in-line X-ray and a Cpk of 1.67 or better. A weld that fails at 0.15 mΩ and 25 N of pull is cheaper in the long run than a hand-soldered busbar, because it eliminates the rework loop. Second, cell grading. I grade incoming cells to capacity ±1 % and DCIR coefficient of variation under 6 %, and I pay for it — because a pack built from matched cells needs less balancing, lives longer, and passes formation the first time. Third, formation and burn-in. A 4-stage aging gate that rejects anything under 98 % capacity or above 30 mV spread at end-of-charge turns invisible defects into a scrap cost instead of a field-return cost.
Every one of these “extra” steps looks like it adds cents to the build. In my data they subtract dollars from the warranty line. The cheapest pack is the one that never comes back, and manufacturing discipline is how you get there while staying inside UN38.3 T.1–T.8 and IATA Section II transport rules (typically 30 % state-of-charge for shipping).
Warranty Reserve, Second-Life, and a Procurement Scorecard
I close every cost-optimization program with a five-point scorecard I hand to procurement:
- $/cycle at the real DoD — not $/kWh, never $/pack.
- Commodity exposure — what fraction of cost rides on cobalt or nickel, and is it hedged?
- Certification status — UN38.3, IEC 62133-2, IEC 62619, UL 2580, and FAA-EASA carriage limits (100–160 Wh per pack is the practical ceiling for carry-on style tools).
- Manufacturing yield — formation first-pass rate and field-return rate at 12 months.
- Second-life path — is there a defined downstream use that recovers 3–6 % of pack value?
Score the supplier on all five, not just price, and the “expensive” quote often wins. That is the whole point of treating this as a system. The same logic applies far beyond tools — when I advise drone programs on a drone battery build, the cost-per-flight-hour model is identical in shape, just with different current and weight weights. And the drone lithium battery packs I have costed use the same grading and welding discipline I described above; the fundamentals travel.
Frequently Asked Questions
Is LFP always cheaper than NMC for power tools?
No. On a $/kWh basis LFP is usually lower, but on a $/cycle basis and especially on a pack-mass basis, NMC still wins for high-current, weight-sensitive tools. Run the TCO model at your real duty cycle before defaulting to either chemistry.
How much can better cell grading really save?
In my programs, tight grading (capacity ±1 %, DCIR CoV under 6 %) typically adds 1–3 % to build cost but removes 4–8 % of field returns and extends pack life 10–20 %. The net $/cycle improvement is usually 15–30 %.
What certification floor should a cost-optimized tool pack meet?
At minimum UN38.3 T.1–T.8 for transport and IEC 62133-2 for portable cells and batteries. For North America add UL 2580, and for industrial-rated cells IEC 62619. Do not let a cost target drop any of these.
Should I over-size the pack to feel safe?
Almost never. Over-sizing adds cell cost and weight with no benefit if the tool never draws the extra current. Model the real peak current and size for an 8–10 % sag headroom at peak, not for the label C-rating.
How do I compare two supplier quotes fairly?
Use the five-point scorecard above and insist on $/cycle at your actual depth-of-discharge. A $2 cheaper pack that halves cycle life is not cheaper — it is a 40–50 % cost increase hiding in plain sight.