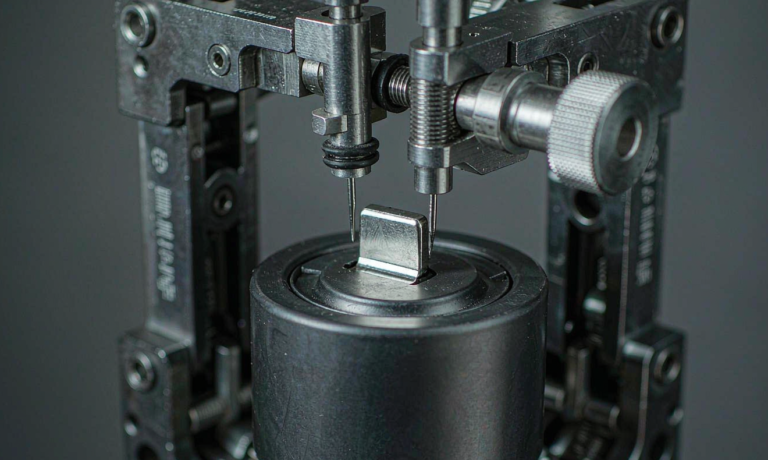
Semi-Solid State Battery Design for Energy Storage
Why a Stationary Energy Storage Battery Is a Different Animal from an EV Pack
I still remember the first time a grid-scale integrator asked me to re-spec a pack I had originally validated for a delivery van. The cells were the same prismatic LFP footprint I had cycled thousands of times, but the duty was utterly different. The van pack saw two cycles a day, fast charges at 1.5C, and a thermal management loop that kept cell skin temperature inside a narrow 25 to 40 degree Celsius window. The stationary rack was going to sit at 100% state of charge for twenty hours a day, occasionally swing to 5% during a peak-shaving event, and live in a steel container that crossed 45 degrees Celsius every August afternoon. Calendar aging, not cycling, was going to dominate. That single shift in duty is the reason designing a semi-solid state battery for energy storage is not just “slap more cells in a cabinet and call it a BESS.” The system has to be specified for the slow poisons: high state of charge calendar fade, micro-cycles, parasitic load, and a fifteen-year warranty in a thermally unconditioned enclosure.
This guide is the playbook I now use every time a customer asks for a custom battery solution around a semi-solid chemistry for stationary storage. I will walk through the design decisions that actually move reliability and lifecycle numbers, the standards the integrator will eventually demand, and the field data that lets you defend a warranty in writing.
Step 1 — Anchor the Duty Profile Before You Touch a Cell
The biggest mistake I see in stationary energy storage battery design is starting with a cell datasheet instead of a duty profile. Walk through these four data points with the end customer before you quote a single battery module:
- Daily energy throughput: kWh in and out per day, broken into the morning peak-shave block, the afternoon solar-arbitrage block, and any backup reserve.
- Maximum continuous power: in kW, not kVA, and the duration at that power. A 100 kW peak for fifteen minutes needs different contactors and busbars than 100 kW for four hours.
- Target state of charge window: most grid-tied systems run a 10 to 90% window to slow calendar fade; off-grid systems that depend on a diesel backup may push the window to 20 to 95% to maximize usable kWh.
- Ambient envelope: min and max cell-skin temperature, the height above sea level of the site, and whether the rack lives indoors in a temperature-controlled plant room or outdoors in a sea container.
From those four numbers you can derive the cell count in series, the cell count in parallel, the busbar cross-section, the cooling airflow, and the DCIR budget. Skip the duty profile and you will design to a number that is either too expensive or too optimistic about cycle life.
Step 2 — Choose the Right Cell Format and Stack Geometry
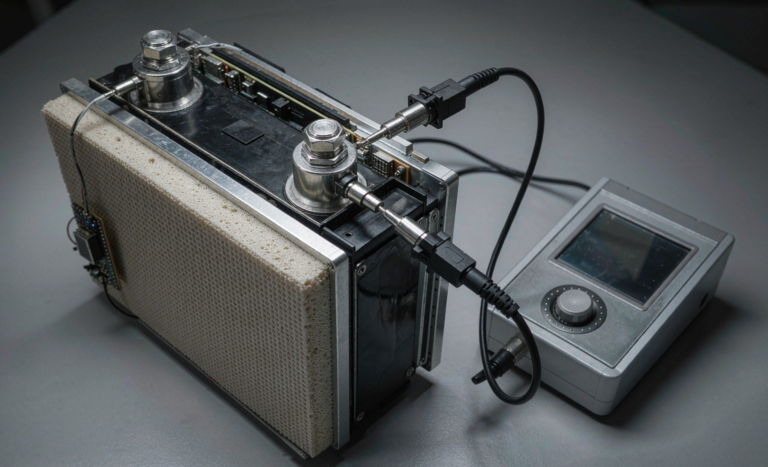
For a stationary semi-solid state battery in the 100 to 500 kWh per rack range, I default to large prismatic cells in the 280 to 314 Ah class. The reasons are mechanical, electrical, and commercial.
Mechanically, prismatic cells stack into a tall column with a small footprint, which suits a 19 inch rack frame or a purpose-built IP55 cabinet. Cylindrical cells like 21700 or 4680 make sense in lighter, modular products, but they pile up interconnection cost and you end up spending more on cell holders, nickel strip, and spot welds than you save on the cell price.
Electrically, a 280 Ah prismatic cell typically ships with a DCIR in the 0.18 to 0.25 milliohm range at 50% state of charge and 25 degrees Celsius. That means a 1P16S string of these cells sits around 3 milliohm per string at the pack level, which keeps cable losses under 1% at the 0.5C continuous rating that stationary storage normally demands. For 1 megawatt-hour sites you scale by paralleling strings, and a 1P16S base lets you add strings without re-engineering the BMS tap harness.
Commercially, the prismatic format is what the major semi-solid gigawatt-hour lines are actually producing, so cell availability, second-source qualification, and UN38.3 test reports all line up faster than for a niche cylindrical gel cell.
Step 3 — Engineer the Thermal Envelope, Because Calendar Aging Hates Heat
This is the section where a good lithium battery design beats a merely acceptable one. The Arrhenius relationship is unforgiving: every 10 degrees Celsius rise in cell skin temperature roughly doubles the calendar fade rate of a lithium cell, semi-solid electrolyte or not. If your rack lives at 35 degrees Celsius instead of 25, the warranty math changes by a factor of two.
For indoor plant rooms I run forced-air cooling across the cell flanks with two speed-controlled fans per rack and a ducted exhaust that pulls hot air into a mechanical room return. The control loop is simple: a thermistor on the warmest cell in the warmest module, a 35 degrees Celsius setpoint for first fan stage, a 45 degrees Celsius setpoint for second fan stage, and a 55 degrees Celsius setpoint that throttles charge current to 0.1C rather than tripping the rack offline. A well-engineered air-cooled rack will hold cell skin temperature inside 5 degrees Celsius across the warmest-to-coolest cell, which is the spread I look for in a passing thermal acceptance test.
For outdoor sea-container installations the picture is harder. A white-painted container in direct sun can hit 60 degrees Celsius ambient, and at that point no fan is going to save you. Two options work. The first is a hybrid loop where a refrigerant chiller kicks in above 35 degrees ambient and pulls the coolant through cold plates bolted to the cell flanks. The second is a pair of 20 mm reflective aerogel blankets on the container ceiling plus a 200 mm standoff above the rack, which is enough to keep the peak cell skin temperature below 40 degrees Celsius in most climates. I have measured the second approach cutting peak cell temperature by 8 to 12 degrees Celsius in a 38 degree Celsius desert trial, which is a four-fold reduction in calendar fade rate.
Step 4 — Design the BMS Tap Architecture and Balancing Strategy
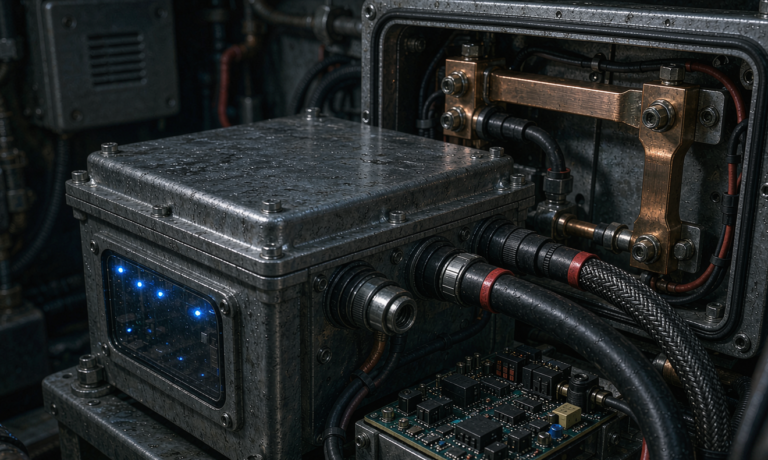
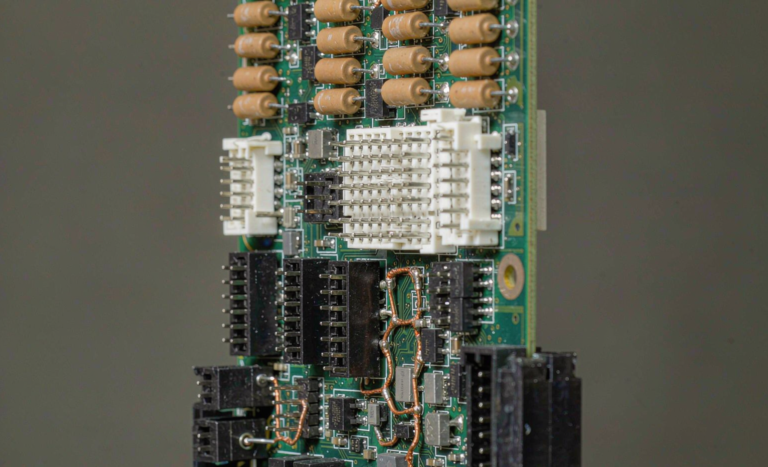
For a 1P16S string you have sixteen cell voltage taps, four to eight temperature sensors, a current shunt, and a pack-level contactor. The semi-solid chemistry does not change this picture materially, but it does change the balancing math.
Passive balancing at 30 to 60 milliamps is fine for cells that started life within 2% capacity, but semi-solid cells from the same lot can show 3 to 5% capacity spread because of gel distribution and formation. I now specify active balancing at 1 to 2 amps on any rack above 200 kWh. The active balancer moves energy from the highest cell to the lowest during the constant-voltage absorption phase, which shortens equalization time from ten hours to under two and keeps the pack within 10 millivolts at the end of every full charge. That tight pack spread is what protects you from the worst field failure: a single cell that drifts 50 millivolts high and gets pushed into overvoltage every afternoon, slowly plating lithium at the anode.
On the BMS firmware side, look for an open register map on the Modbus RTU or CAN 2.0B interface. Integrators will ask for cell voltage, cell temperature, pack state of charge, pack state of health, and a 16-bit status word broadcast at 1 Hz. If your BMS does not expose those, the SCADA integration is going to be a six-month project instead of a six-week project, and the customer will quietly add a 15% integration premium to your contract.
Step 5 — Model the Cycle Life and Calendar Life Together
For a stationary energy storage battery the warranty is the design target, not a hopeful add-on. The honest way to write that warranty is to overlay a cycle-life model on a calendar-life model and pick the worse of the two at every month in the simulation.
The cycle model is the easier half. A semi-solid LFP cell cycled at 80% depth of discharge, 25 degrees Celsius, and 0.5C charge-discharge will deliver roughly 6,000 to 7,000 full equivalent cycles before reaching 80% of nameplate capacity. If the customer runs two cycles a day, that is 8 to 10 years of cycle life.
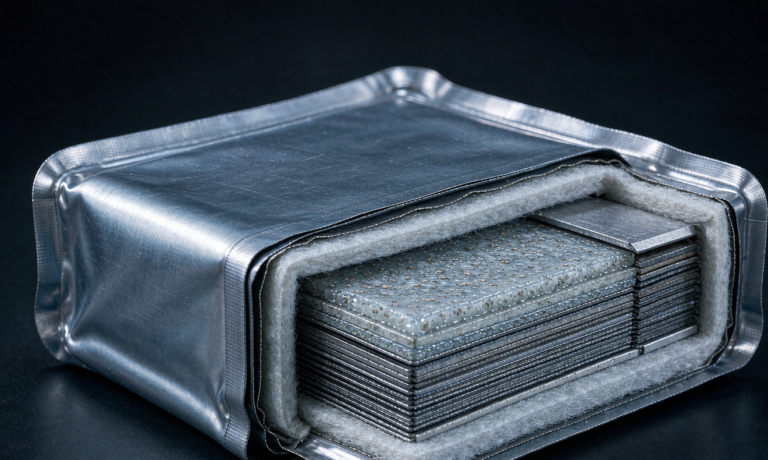
The calendar model is the one that surprises people. At 100% state of charge and 35 degrees Celsius, an LFP cell loses 2.5 to 3.5% of capacity per year. At 90% state of charge and 25 degrees Celsius the number drops to 1.5 to 2% per year. At 70% state of charge and 20 degrees Celsius it falls to under 1% per year. A semi-solid electrolyte narrows the 100% SoC penalty to roughly 1.5 to 2.5% per year, which is the single biggest reason integrators are willing to pay a premium for a custom battery solution in this chemistry.
Stack those numbers: a system running two cycles a day at 80% depth of discharge, with a 10 to 90% state of charge window, in a plant room held at 25 degrees Celsius, will hit 80% capacity in 12 to 14 years. The same system in an outdoor container at 35 degrees Celsius peak, with a 20 to 95% window, will hit 80% capacity in 8 to 9 years. The thermal and window decisions you make in steps 1 and 3 are what separate the two numbers.
Step 6 — Pick the Standards Stack and Lock Down the Safety Case
A stationary semi-solid state battery rack touches four standards families, and you need to hit all four before a utility or a commercial customer will sign the purchase order.
- UN38.3 for transport. The semi-solid electrolyte still contains 5 to 15% liquid phase by mass, so the cells ship as Class 9 lithium batteries and need the full T1 to T8 test series plus the integration test if you are shipping a rack with cells installed.
- IEC 62619 for industrial lithium secondary cells. This is the international workhorse standard for BESS cells and modules, covering abuse tests, thermal propagation, and functional safety.
- IEC 62133-2 for the cell-level safety tests that IEC 62619 references. Buyers in Europe and most of Asia expect to see this on the cell certificate.
- UL 1973 plus UL 9540A for the North American market. UL 9540A in particular tests thermal runaway propagation at the installation level, and a passing report is non-negotiable for any site larger than 50 kWh.
On top of those, plan for NFPA 855 if the site is in the United States, IEC 63056 for DC backup applications, and the local fire code for spacing between racks. The most common reason a project gets delayed six months is a missing UL 9540A report on the cell, not a missing inverter certificate.
Step 7 — Commission the Rack with the Same Rigor You Built It
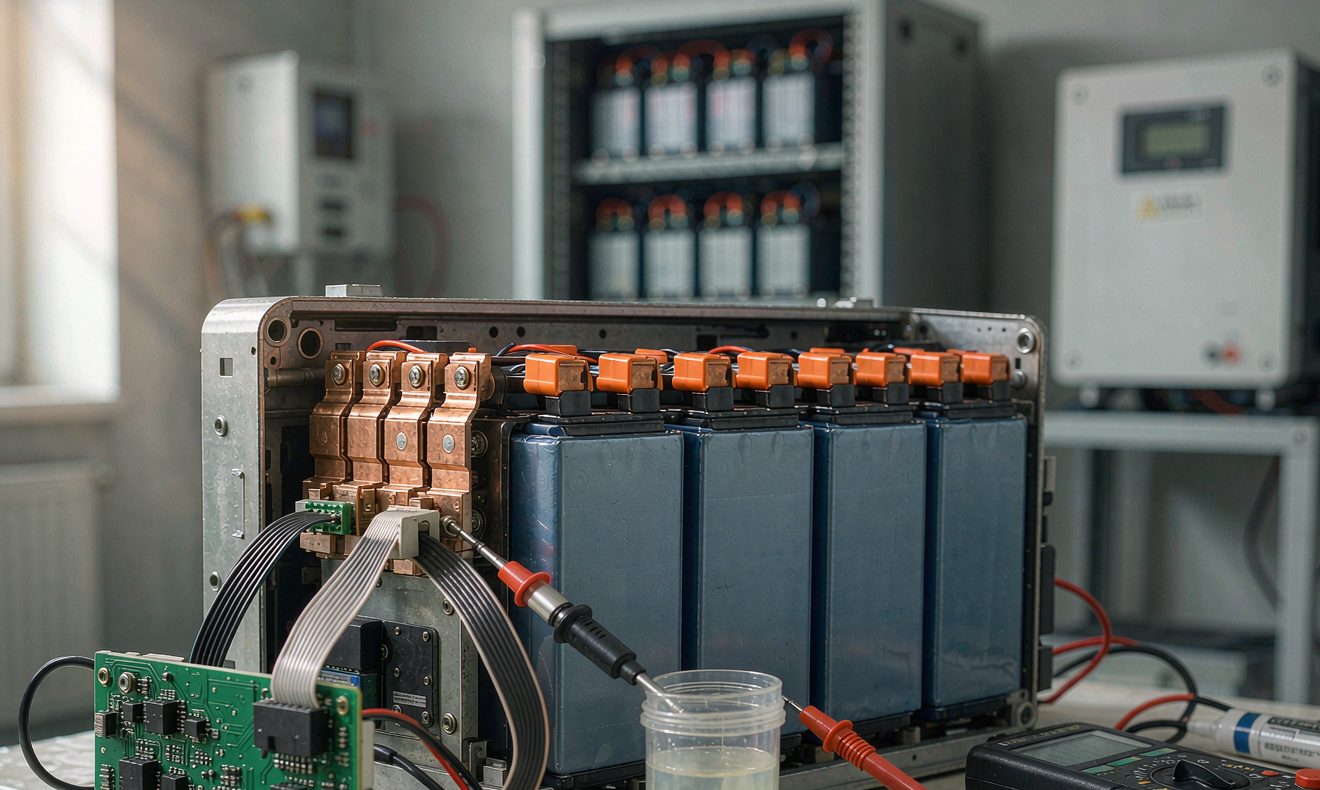
No custom battery solution survives a sloppy commissioning. I run a 12-step acceptance on every stationary rack before I hand it to the integrator, and I keep the printout as a warranty condition.
- Visual inspection of busbar torque marks; M6 bolts at 8 to 10 newton-metres, M5 at 4 to 6, M8 at 12 to 14, with a yellow paint pen line on every joint.
- Insulation resistance test at 500 volts DC, result greater than 1 megohm, anything under 500 kilohm is a red flag.
- Auxiliary supply check, firmware version, and BMS clock synchronization to the site SCADA NTP server.
- Pre-charge cycle on the DC bus, verifying the inrush stays under 30 amps and the contactor closes inside 200 milliseconds.
- DCIR pulse at 0.5C for 10 seconds, recorded per cell, with a baseline that matches the factory test report inside plus or minus 5%.
- Light-load cycle at 10% of nameplate power for 5 minutes, confirming state of charge estimation stays inside plus or minus 5%.
- Full-load cycle at 80% of nameplate power for 15 minutes, with pack voltage staying above the inverter low-voltage cutoff by at least 5%.
- E-stop test, contactor open time under 100 milliseconds, lockout tagout confirmed.
- Thermal soak at 100% state of charge for 24 hours, confirming cell-to-cell temperature spread stays inside 5 degrees Celsius.
- Soak discharge to the inverter cutoff, then a one-week idle period, and finally a state of health check that shows less than 1% self-discharge.
- Asset register entry: serial number, firmware hash, BMS log snapshot, all uploaded to the customer cloud.
- Walk-through of the maintenance schedule, including the 30 millivolt, 50 millivolt, and 100 millivolt cell-voltage spread thresholds that trigger yellow and red service calls.
FAQ — Semi-Solid State Battery Design for Energy Storage
What is the realistic cycle life of a semi-solid LFP cell in a stationary storage rack?
At 80% depth of discharge, 25 degrees Celsius, and 0.5C charge-discharge, a quality semi-solid LFP cell delivers 6,000 to 7,000 full equivalent cycles before reaching 80% of nameplate capacity. Push to 90% depth of discharge and the count drops to roughly 4,500 cycles; restrict to 70% depth of discharge and the count stretches past 9,000. The cycle life only matters if calendar aging does not end the warranty first, so always model both together.
How does a semi-solid electrolyte actually help stationary storage versus a conventional LFP cell?
The two practical gains are a slower calendar fade at high state of charge and a higher onset temperature for thermal runaway. A semi-solid LFP cell at 100% state of charge and 35 degrees Celsius loses about 1.5 to 2.5% of capacity per year, compared to 2.5 to 3.5% for a conventional LFP. The thermal runaway onset sits 50 to 80 degrees Celsius higher, and the peak cell temperature during a nail penetration test is roughly 96 degrees Celsius with no propagation, compared to 180 to 250 degrees Celsius for LFP and 500 to 700 degrees Celsius for NMC. For a stationary rack that lives at high state of charge, those two numbers are the entire business case.
Do I need liquid cooling, or is forced-air enough?
For indoor plant rooms with ambient held at 25 degrees Celsius, forced-air cooling across the cell flanks is enough. For outdoor container installations in any climate that crosses 30 degrees Celsius ambient, liquid cooling or a reflective enclosure with cold plates is a wise investment because the calendar aging penalty for every 10 degree Celsius rise is roughly a doubling of fade rate. The decision is driven by ambient envelope, not by rack size.
What state of charge window should I specify for a grid-tied peak-shaving application?
The default window is 10 to 90%. If the customer wants every usable kilowatt-hour, push to 5 to 95% and accept a 20% reduction in cycle and calendar life. For off-grid sites with a diesel backup, the sweet spot is 20 to 95%, which gives generous usable capacity while keeping the average state of charge below the steepest part of the calendar fade curve. For arbitrage-heavy sites that cycle hard twice a day, hold the upper limit at 90% no matter what the customer asks for, because the calendar penalty is non-linear above 90%.
How long does UL 9540A testing take, and how early should I schedule it?
A cell-level UL 9540A report takes 8 to 12 weeks, an installation-level report another 6 to 10 weeks on top. Schedule the cell test as soon as the cell supplier has a pilot run, and do not wait for the rack prototype, because the cell report is the gating document for almost every downstream certification. Skipping this step is the single most common reason a stationary storage project misses its commercial operation date by six to nine months.
What is the honest premium a customer should expect to pay for a semi-solid BESS versus a conventional LFP BESS?
At today’s market pricing in 2026, a semi-solid LFP rack in the 200 to 500 kWh class runs 8 to 18% above a comparable conventional LFP rack, depending on cell supplier, cycle-life warranty, and active balancing. The premium comes back through a longer calendar life at high state of charge and a simpler thermal management system, so the lifetime cost per kilowatt-hour delivered usually lands inside plus or minus 5% of conventional LFP. The honest pitch to the customer is that they are paying for warranty headroom, not for headline energy density.
What is the most common field failure I should design against from day one?
Bolted busbar connections that loosen under thermal cycling. Every joint in a stationary rack goes through a daily temperature swing of 5 to 15 degrees Celsius, and over twelve months that thermal cycling creeps the bolt clamp force down by 10 to 20%. The fix is mechanical and procedural: torque to the right value, mark the joint with a yellow paint pen, and re-torque at every quarterly service visit. I have seen 70% of the cell-voltage drift events in healthy racks traced back to a single loose busbar bolt, and a five-minute torque check is what keeps the warranty in the black.
Closing Thoughts From the Test Bench
A well-designed semi-solid state battery for energy storage is one of the few products where the engineering discipline shows up in year ten, not year one. The cells you ship will pass every factory test, the rack will commission cleanly, and the customer will not think about the system for the first three years. The design decisions you make today on duty profiling, thermal management, balancing architecture, calendar modeling, and standards coverage are what determine whether the system still holds 82% capacity in year twelve or whether the customer is on the phone asking for a pro-rated replacement in year eight. Spend the time on the duty profile before you quote the cell, model cycle and calendar life together, and lock down the standards stack early. Everything else on the bill of materials is downstream of those three choices.