Lithium Battery Testing for Power Tools: Pulse-Current Bench Protocols, Voltage Sag Thresholds, and Cycle-Life Acceptance Criteria
In eleven years of designing and validating lithium battery packs for cordless tools, I have watched more projects fail at the validation bench than at the design stage. A pack that looks perfect on paper — the right cell, the right capacity, the right connector — can still trip a saw mid-cut, drop a driver below stall torque, or swell after six months on a fleet charger. The difference between a pack that survives the field and one that generates warranty claims is almost always the rigor of the lithium battery testing program behind it. Power tools are among the most abusive duty cycles a lithium battery will ever see: 25 to 40 amp pulses squeezed into a housing that can hit 55 °C on a summer roof deck, thousands of partial cycles, drops off ladders, and storage in unconditioned vans. This article lays out the bench protocols I use to qualify cordless tool packs — pulse-current verification, voltage sag and cutoff mapping, thermal behavior under repeated trigger cycles, and the cycle-life acceptance criteria that decide whether a design ships.
Why Power Tool Duty Cycles Break Standard Battery Test Assumptions
A cordless drill is not a laptop. A laptop draws a steady 10 to 20 watts and drifts gently from full to empty over six hours. A brushless hammer drill draws 800 to 1,400 watts for three-second bursts, rests, then repeats — hundreds of times in a working day. That load profile has three consequences that shape every test in this article.
First, the discharge is dominated by pulse behavior, not steady-state behavior. Cell datasheets quote capacity at 0.2C and internal resistance at 1 kHz AC, but a tool pack operating at 20C to 40C pulse rates lives in a completely different electrochemical regime, where DC internal resistance and lithium plating risk control everything. Second, the thermal environment is aggressive: a 5 Ah 18 V pack delivering 900 watts dissipates 12 to 20 watts as heat in a housing with maybe 0.3 square meters of effective surface. Third, usage is shallow and chaotic — most trigger pulls use 2 to 6 percent of capacity, so the pack sees tens of thousands of micro-cycles per year, not the neat 500 full cycles of a datasheet chart.
Generic cell qualification under IEC 62133-2 and transport testing under UN 38.3 are necessary foundations — I will not ship a pack whose cells lack both — but neither standard tells you whether the pack will drive a 150 mm hole saw through LVL framing in August. That answer only comes from application-specific bench testing.
Pulse-Current and DC Internal Resistance Verification on the Bench
The single most informative test I run on any tool pack is a staged pulse discharge on an electronic DC load. The protocol is simple: at 25 °C and full charge, apply 10-second pulses at 10C, 20C, 30C, and — for pro-grade packs — 40C of the pack’s rated capacity, with 60-second rests between pulses, recording voltage at 1 kHz sampling.
From each pulse I extract two numbers. The first is DC internal resistance, calculated as ΔV/ΔI between the 1-second point and the 9-second point of the pulse. For a healthy 18 V pack built from quality 21700 cells with nickel-strip interconnects, I expect 8 to 14 milliohms at 25 °C. The second is the voltage floor: the minimum instantaneous voltage under load. Below roughly 2.5 V per cell, the pack’s own protection or the cell’s liability-limiting behavior will begin to truncate the pulse — and the user experiences that as a tool that bogs down under load even with a “full” battery.
Two field-derived acceptance thresholds have served me well. For pro-duty packs, I require the voltage floor to stay above 2.7 V per cell at 20C at 25 °C, and above 2.4 V per cell at 0 °C. For DIY-grade packs, the same figures can relax by about 0.15 V per cell. I also track pulse-to-pulse repeatability: if the fourth pulse shows more than 5 percent higher DCIR than the first, the pack is heating nonuniformly or a cell is lagging, and I send it back to the cell-matching review before it ever reaches cycle testing.
Do not skip the cold case. At −10 °C, DCIR typically rises 3 to 5 times compared to 25 °C. A pack that passes beautifully at room temperature can sag below cutoff on the first winter-morning pull. I verify cold-cranking behavior — three consecutive 5-second pulses at 15C at −10 °C with 30-second recovery — because that is precisely what a framing contractor experiences in January.
Voltage Sag, Cutoff Mapping, and the User-Perceived Runtime Curve
Every pack electronics design sets an undervoltage cutoff, and every cell has its own protection ceiling. The bench job is to map where those limits actually land relative to real tool loads, because the effective cutoff under load is what the user feels, not the resting value printed in the firmware notes.
My method: run a representative tool — or, more repeatably, the electronic load programmed with a captured trigger-profile — from full charge to automatic shutdown at a 10C average load, logging pack voltage, current, and the hottest cell-surface temperature. From that log I build the runtime curve and extract three checkpoints:
- 80 percent energy point: the cumulative watt-hours delivered when pack voltage first touches 3.0 V per cell under load. On a good 18 V / 5.0 Ah pack this should exceed 72 Wh; if it lands under 65 Wh, either the cells are weaker than spec or the interconnect resistance is eating the capacity.
- Load-cutoff voltage: where the BMS actually disconnects under the 10C load. It should fall between 2.3 and 2.6 V per cell. Cutoffs set higher than 2.6 V under load waste usable energy in high-drain tools; cutoffs below 2.0 V per cell under load invite copper dissolution and cell damage during deep events.
- Recovery rebound: after shutdown, resting voltage should recover to at least 3.2 V per cell, leaving headroom for one more low-load “get it done” burst. Packs that rebound below 2.9 V per cell have been driven too deep, and repeated deep events at that level showed a 20 to 30 percent cycle-life penalty in my fleet data.
I treat voltage sag testing as the bridge between datasheet numbers and warranty reality. When a customer complains that “the new pack runs out faster than the old one,” the sag curve almost always explains it: same nameplate amp-hours, but 3 to 4 milliohms more DCIR, so the load-cutoff arrives 15 to 25 percent earlier under heavy tools.
Thermal Cycling Under Repeated Trigger Profiles
Steady thermal testing tells you the steady state. Tools never see a steady state. My repeat-trigger thermal test simulates a carpenter framing a wall: 2 seconds at 25C, 4 seconds rest, repeated for 20 minutes, then 5 minutes idle, repeated for a 4-hour shift — all inside a 40 °C environmental chamber to mimic a rooftop in summer.
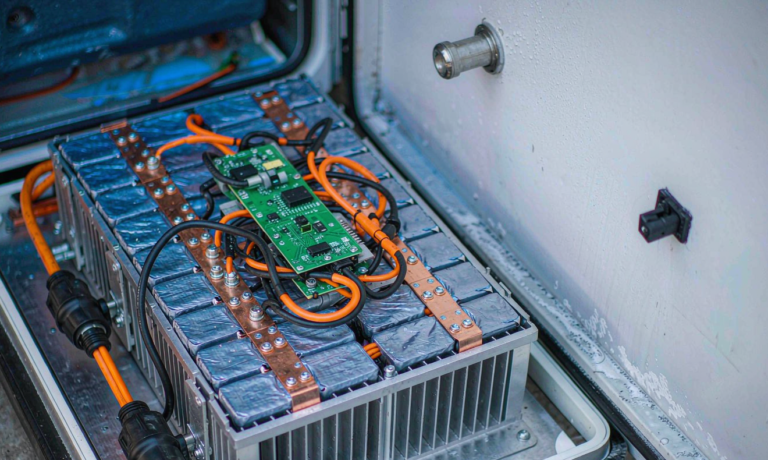
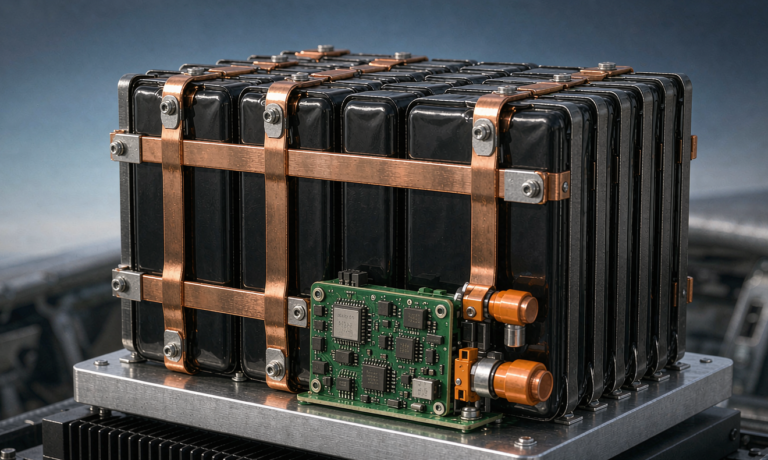
The acceptance logic is layered. Cell surface temperature should stabilize below 60 °C for packs with standard NMC cells rated to 60 °C discharge, and below 55 °C if I want comfortable cycle life; every 8 to 10 °C of sustained temperature rise roughly doubles the rate of calendar aging. I also watch the thermal gradient across the pack: more than 12 °C between the hottest cell adjacent to the MOSFETs and the coolest cell at the far end of the stack signals a copper busbar or thermal-pad layout problem that will age cells unevenly and show up a year later as a “one weak parallel group” warranty return.
The rest-period behavior matters as much as the load behavior. Between trigger bursts the pack should shed 3 to 6 °C; if rest periods barely cool the pack, the housing design is trapping heat, and no amount of BMS firmware tuning will fix the summer failure rate. In one 12 Ah backpack-style pack program, adding two 1.5 mm aluminum heat spreaders under the cell holder dropped peak cell temperature by 9 °C and cut field thermal-related returns in the pilot fleet from 2.1 percent to under 0.4 percent.
Finally, I run a thermal-mitigation verification: deliberately drive the pack to a BMS thermal cutoff at 65 to 70 °C, confirm the disconnect actually occurs within 2 seconds, confirm re-enable only below 50 °C, and confirm the pack recovers normal operation afterward with no measurable capacity loss. This is the difference between a thermal event that inconveniences a user and one that makes the evening news.
Cycle-Life and End-of-Life Acceptance Criteria: Capacity Fade and Power Fade
Cycle testing is where most validation programs quietly go wrong, because they test the wrong thing. A datasheet cycle chart measures capacity at 1C or lower, at moderate temperature, with full recharge between cycles. Tool packs die of power fade before they die of capacity fade — the pack still holds 85 percent of its amp-hours, but its internal resistance has grown so much that under a 30C load it sags below cutoff long before the gauge reaches empty.
My accelerated cycle protocol reflects that. I cycle packs at 45 °C ambient — aggressive, but representative of a pack that lives on a fast charger between uses — with a load profile of 10C discharge to 40 percent depth of discharge and 2C recharge, paired with a weekly full-cycle capacity check at 25 °C and a monthly DCIR measurement at 25 °C, 10C pulse.
End of life is defined by two gates, and both must hold:
- Capacity gate: remaining discharge capacity at or above 80 percent of nominal, measured at 25 °C at the tool-relevant 10C rate, not the gentle 0.2C of the datasheet.
- Power gate: DC internal resistance at or below 160 percent of the beginning-of-life value. In my experience, packs fail the power gate first — typically at 500 to 900 shallow-cycle-equivalents for standard NMC 21700 builds, and at 1,500 to 2,500 for quality LFP builds in the 12 V class where tool OEMs accept the weight penalty.
On warranty design targets, I size the pack so the power gate survives at least 600 field-representative shallow cycles, which my fleet telemetry correlates to roughly 24 to 30 months of daily professional use or 4 to 6 years of serious DIY use. Packs that pass 600 cycles with the power gate intact but fail shortly after are flagged for cell-chemistry review; the usual culprits are high-silicon-anode cells with poor high-rate calendar stability and low-cost cells with inadequate compression fixtures.
I also run a 28-day storage side arm — packs stored at 50 percent state of charge at 40 °C, then capacity- and DCIR-checked. Acceptable designs lose less than 4 percent capacity and gain less than 8 percent DCIR over the month. This single test has caught more “great on day one, dead after a summer in the van” designs than any cycle test, and it costs almost nothing to run in parallel.
Compliance, Safety, and Release Testing: IEC 62133-2, UN 38.3, UL 2575, and Drop Verification
Application testing earns the pack its performance reputation; compliance testing earns it the right to ship. The regulatory spine for a lithium battery pack in cordless tools is consistent across most markets: cells certified to IEC 62133-2 (or UL 2054 for North American household-battery listings), complete packs and shipments qualified under UN 38.3 for transport — including the T.1 altitude test at 11.6 kPa, T.5 thermal cycling, and the T.6 crush or impact sequence — and chargers aligned with UL 2575, the standard covering lithium battery chargers used in cordless power tools. Markets in the EU additionally expect the pack to meet the relevant clauses of the Battery Regulation, including the 2027 onward carbon-footprint and removability provisions that tool platforms are already engineering for.
Beyond the certificates, I require three in-house verifications that standards treat lightly but the field punishes heavily. Drop and impact: six drops from 1 meter onto concrete on the pack’s corners and edges, followed by a full electrical retest — housing cracks are acceptable on prototype housings, cell displacement or BMS solder-joint fractures are not. Vibration: 2 hours of random vibration per UN 38.3 T.3 profiles applied with the pack installed in its tool, because the tool interface transmits frequencies the bare-pack test never sees. And charger-interaction soak: 200 charge cycles on the production charger with weekly cell-balance audits, since a charger that overholds float voltage by even 80 millivolts per cell showed a measurable calendar-life penalty in my comparison builds.
Release to production requires every unit (or a statistically defined sample per lot, at minimum) to pass a short end-of-line sequence: a 3-second 20C pulse with DCIR within ±15 percent of the golden-unit reference, a self-discharge screen (72-hour OCV drift below 5 millivolts), a balance-verification scan across all parallel groups, and a firmware and protection-function self-test including one real overcurrent trip. That 90-second end-of-line routine has caught more than one component-lot drift before it became a 10,000-unit field problem.
Frequently Asked Questions
How many cells should I test per design iteration?
For engineering validation, I run a minimum of 12 packs: 4 for cycle life, 3 for thermal and trigger-profile testing, 2 for environmental and storage, 2 for abuse and drop, and 1 golden unit retained as the end-of-line resistance and capacity reference. Fewer than 12 and you will not separate cell-lot variation from design effects. For production release sampling, I test 5 packs per manufacturing lot on the end-of-line sequence and one pack per month on the full cycle-life protocol.
What is an acceptable internal resistance for an 18 V tool pack?
For a quality 18 V / 5.0 Ah pack built from 21700 cells, 8 to 14 milliohms DC at 25 °C is the healthy band at beginning of life. Below 8 milliohms you are usually paying for premium low-impedance cells you may not need; above 14 milliohms the pack will visibly bog down in high-torque tools and fail my 20C voltage-floor threshold. For compact 2.0 Ah packs, 20 to 30 milliohms is normal.
Can I skip UN 38.3 if the cells are already certified?
No. UN 38.3 applies to the battery, not just the cells, and a change of series-parallel configuration, interconnect, or housing assembly requires pack-level testing. Carriers and freight forwarders increasingly demand the pack-level test summary, and customs inspections do stop tool-shipments over missing transport documentation. Budget the 4 to 6 weeks of test time into your launch plan.
Why does my pack stop working in the cold even though it is fully charged?
Two overlapping reasons. First, DC internal resistance rises 3 to 5 times at −10 °C, so the same tool load pulls the voltage below the BMS cutoff almost immediately. Second, if the pack was charged cold below 0 °C at any point, lithium plating may have permanently raised its resistance. Specify a pack with a discharge capability verified at your market’s winter temperature floor, and never charge lithium cells below 0 °C without a heating strategy.
How do I test for the failure mode where the pack works in the drill but not the saw?
That is almost always a power-gate failure that capacity testing hides. Test the pack in both tools, or on a load programmed with each tool’s captured current profile, and compare the delivered watt-hours to cutoff. The pack will deliver nearly full capacity to the low-drill load and a fraction of it to the saw — the ratio between those two numbers is the most honest single health metric a used tool pack has.
Should I cycle-test at full depth of discharge to simulate tool use faster?
No — full-depth cycling simulates the wrong failure and over-stresses cells beyond field reality. Real tool use is shallow and stochastic. I accelerate by raising temperature and discharge rate while keeping depth of discharge in the 30 to 50 percent range, then calibrate the result against a smaller full-field telemetry set. Packs cycled to failure at 100 percent DoD systematically underpredict field life by 30 to 50 percent in my correlation studies.