Lithium Battery State of Health Reporting for Fleets
When a delivery drone or an electric airport tug goes dark mid-shift, the failure is almost never a surprise to the battery. The cells told us weeks earlier through a slow, measurable drift in capacity and internal resistance. The problem is that most fleets never listen. After twelve years building packs at Horizon Power and watching thousands of lithium modules cycle in the field, I am convinced that state of health (SoH) reporting is the single highest-leverage discipline a fleet operator can adopt. It turns a black-box consumable into a managed asset with a predictable retirement date.

Why State of Health Reporting Matters for Fleet Operators
A fleet is only as reliable as its weakest pack, and weak packs hide in plain sight. Two batteries that look identical on a state-of-charge (SOC) gauge can have 30 percent different usable capacity. Without SoH reporting, dispatchers treat them as equals, and the one with degraded cells becomes the failure that grounds an aircraft or stalls a tug.
I have seen operators retire entire batches early out of caution, throwing away 40 percent of remaining life, simply because they had no trustworthy health signal. Conversely, I have seen packs run far past safe limits because nobody noticed resistance creep. SoH reporting fixes both errors by quantifying remaining useful life in hard numbers.
- It converts guesswork into scheduled maintenance windows.
- It protects warranty claims with objective cycle and temperature history.
- It lets you right-size replacement budgets instead of stocking blindly.
- It feeds safety reviews with evidence, not anecdote.
How We Define and Measure State of Health
State of health is, at its core, a ratio. We define it as the current maximum deliverable capacity divided by the rated capacity at end of line, expressed as a percentage. A pack that once held 100 ampere-hours and now holds 80 is at 80 percent SoH. Resistance growth is the second axis: as lithium cells age, their internal resistance climbs, raising heat and voltage sag under load.
Measuring that ratio accurately is the hard part. Coulomb counting alone drifts, so at Horizon Power we combine three methods:
- Coulomb counting with periodic full calibration. We reset the counter on a controlled full charge to a known cutoff voltage, which corrects accumulated integration error.
- Electrochemical impedance spectroscopy (EIS). A small alternating current sweep reveals the growth of the solid electrolyte interphase layer and contact resistance, both early aging signatures.
- Incremental capacity (ICA) and differential voltage analysis. Plotting capacity against voltage exposes the slow disappearance of specific lithiation peaks that mark cathode or anode degradation.
In my experience, LFP lithium ion battery cells fade about 2 to 3 percent of capacity per 100 full-equivalent cycles under moderate duty, while NMC chemistries often fade 1 to 2 percent but from a higher starting energy density. Reporting both capacity and resistance gives operators a complete picture rather than a single misleading number.
Building the Data Pipeline From Cell to Dashboard
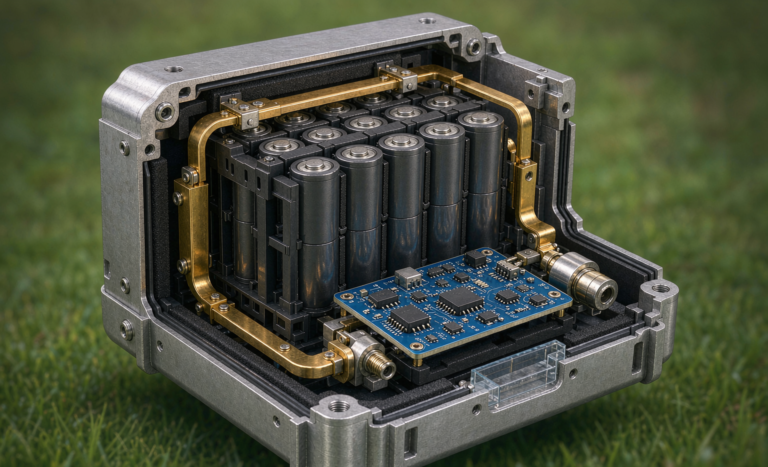
A lithium battery does not report anything on its own. The signal is born in the cell, captured by the battery management system (BMS), packaged on a bus, and finally delivered to a dashboard where a human can act. Each hop is a place where data can be lost or corrupted.
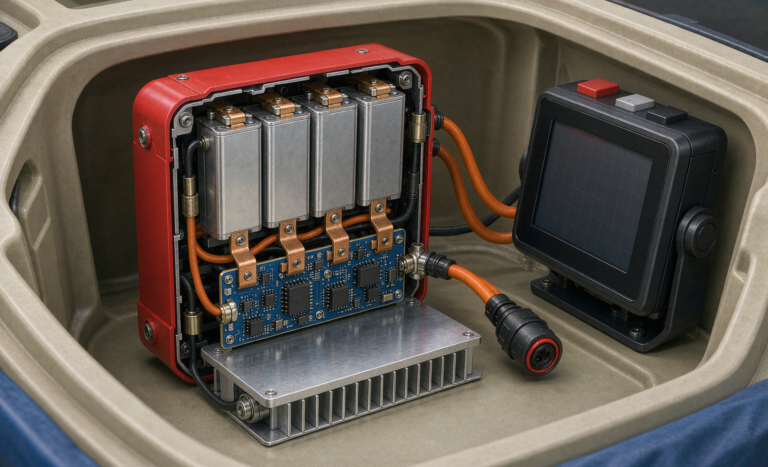
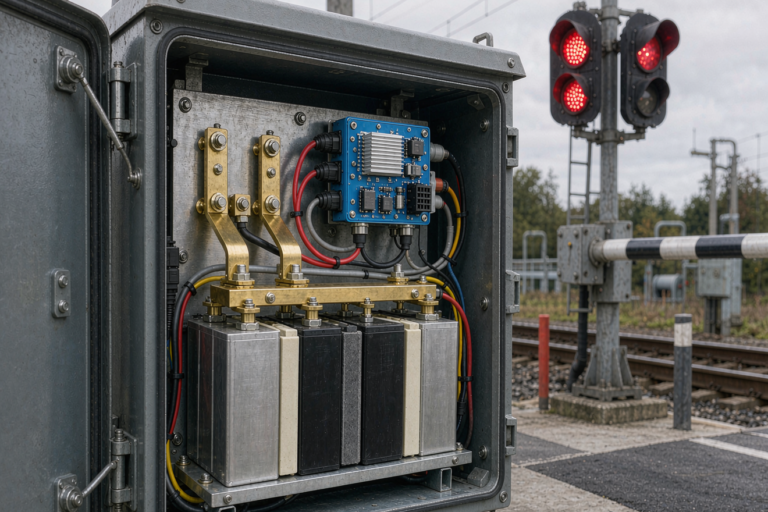
Inside every lithium battery pack, a banking-grade BMS samples every cell voltage and temperature at one to ten hertz. It computes SOC and a live SoH estimate, then pushes that estimate over a wired interface. For fleet work we standardize on CAN bus for vehicle-mounted packs and RS485 or SMBus for stationary cabinets, with Modbus as the common SCADA bridge.
The edge gateway is where most projects fail. A raw BMS stream is noisy and vendor-specific, so we normalize it into a timestamped record: pack ID, cycle count, average cell temperature, maximum delta temperature, capacity estimate, and resistance estimate. That record travels over MQTT or HTTPS to a cloud store, where it is aggregated per asset and per fleet.
The dashboard is the payoff. A good view shows each asset’s SoH trend, flags packs crossing a 70 or 80 percent threshold, and overlays duty profile so you can see that the pack working night shifts in Phoenix is aging twice as fast as its twin in Denver. I tell every operator: if your SoH data does not change a single scheduling decision, you are collecting it for nothing.
Standards and Compliance You Cannot Ignore
SoH reporting is not just operational hygiene; for regulated fleets it is part of demonstrating airworthiness and safety. The standards I reference most in fleet programs are UN38.3 for transport, IEC 62133 for cell and pack safety, IEC 62619 for industrial stationary use, and the aviation frameworks from FAA and EASA.
- UN38.3. Required for shipping lithium cells and packs. While it is a transport test, the documentation discipline it enforces (test summaries, cell lots) is the same rigor a health-reporting program needs.
- IEC 62133. The baseline safety standard for portable cells and packs, covering short circuit, overcharge, and thermal abuse. Age-related resistance growth is exactly what pushes a pack toward these failure modes.
- FAA and EASA. For manned and unmanned aviation fleets, airworthiness reviews increasingly ask for evidence that battery health is monitored and that end-of-life is enforced before risk climbs. A clean SoH log is your fastest path through that review.
We build the reporting schema so that an auditor can trace any pack from its serial number back to its cell lot, test summary, and full cycle history. That traceability is what separates a compliance asset from a liability.
Turning SoH Data Into Actionable Fleet Decisions
The number on the screen means nothing until it triggers a decision. In a mature program, SoH drives four concrete actions. First, it sets a retirement threshold. We typically pull packs at 70 to 80 percent SoH for aviation and 60 to 70 percent for ground support, balancing safety margin against cost. Second, it informs redeployment: a degraded pack that is risky on a drone is perfectly safe on a slow-cycling backup cabinet.
Third, SoH trends expose abuse. A pack whose resistance spikes after a hot summer is telling you the cooling design or duty profile needs review. Fourth, aggregated fleet data guides procurement. If every pack of a certain model ages poorly under your duty cycle, that is a specification gap to fix in the next custom battery solution rather than a maintenance problem to paper over.
I have watched a single redeployment rule extend a customer’s effective pack count by 15 percent without buying a single new module. The data was always there; nobody had wired it to a decision.
Common Pitfalls and How We Avoid Them
Most failed SoH programs die for predictable reasons. The first is calibration drift: a BMS that never sees a full charge loses the reference point it needs, and SoH wanders. We enforce a scheduled full-calibration cycle at the pack level. The second is temperature blindness: capacity fade is heavily temperature dependent, so a health number without a duty-temperature context is misleading. We always report SoH alongside average and peak operating temperature.
The third pitfall is treating SOC and SoH as interchangeable. A pack at 90 percent SOC can be at 60 percent SoH. Confusing the two is how operators get stranded. The fourth is vendor lock-in on telemetry: if your data lives only inside a proprietary app, you cannot build the cross-fleet analytics that pay off. We export open formats so the data is yours.
Finally, do not wait for a failure to start reporting. The cheapest SoH program is the one designed into the pack from day one, not bolted on after the first incident report lands on your desk.
Frequently Asked Questions
What is a good state of health percentage for a lithium battery?
For aviation and high-safety fleets we retire at 70 to 80 percent SoH. For ground support and stationary storage, 60 to 70 percent is usually acceptable. The right threshold depends on your duty cycle and risk tolerance, not a universal rule.
How often should fleet battery SoH be reported?
SoH itself changes slowly, so a daily or weekly snapshot is enough for most fleets. The underlying cell data should stream continuously so trends are smooth, but the reported health figure only needs periodic refresh.
Can state of health reporting predict battery failure?
It predicts the gradual failures that cause most downtime, such as capacity loss and resistance creep. It is less able to catch sudden manufacturing defects, which is why we pair SoH with continuous thermal and voltage anomaly detection.
What communication protocol do fleet BMS use for SoH data?
Vehicle-mounted packs commonly use CAN bus, stationary cabinets use RS485 or SMBus, and both bridge to SCADA through Modbus. The edge gateway then forwards normalized records over MQTT or HTTPS to the cloud.
How does temperature affect lithium battery state of health?
Higher average and peak temperatures accelerate both capacity fade and resistance growth. A pack running hot in summer can age two or three times faster than an identical pack in a temperate climate, which is why we always report SoH with its temperature context.
Is SoH reporting required for aviation drone fleets?
FAA and EASA do not mandate a specific SoH percentage, but airworthiness reviews increasingly expect demonstrable battery health monitoring and enforced end-of-life. A clean, auditable SoH log is the strongest evidence you can present.
Further Reading
References