Semi-Solid State Battery Cost Optimization for EV Packs (2)
I have spent the better part of a decade on both sides of the battery cost conversation — designing quasi-solid cells on the lab bench and, more recently, sitting across the table from EV procurement teams as Horizon Power’s senior engineer. The question I hear most is deceptively simple: “when will semi-solid state batteries be cheap enough to win the pack?” The honest answer is that semi-solid state battery cost optimization for EV packs is not a single lever you pull. It is a stack of four engineering and commercial decisions — commodity exposure, manufacturing scale, pack architecture, and residual value — that compound on each other. In this article I walk through the numbers we actually use when we quote a pack, and where the real savings hide.
The Real Cost Stack — Where the Money Actually Goes
Before we optimize anything, we have to agree on what we are measuring. A finished EV pack is roughly 75–82% cell cost and 18–25% pack-level cost (enclosure, thermal system, BMS, harness, and assembly labor). Quasi-solid chemistry changes the cell line item in two opposite directions at once, which is why naive “$/kWh” comparisons mislead buyers.
On the materials side, a semi-solid state battery cathode typically carries 30–45% less cobalt than a conventional high-cobalt NMC811, and the gel electrolyte removes 40–60% of the solvent mass found in a liquid cell. Those are real savings. But the quasi-solid separator coating and the higher-purity lithium salt add cost back. At low production volume we usually see cell cost land 8–15% above a comparable liquid NMC cell. The entire game of cost optimization is closing — then inverting — that gap as volume climbs.
Raw-Material Exposure and Sourcing Strategy
Lithium, nickel, and cobalt prices have each swung two-to-three-fold within single calendar years. For an EV program shipping 50,000 vehicles a year, a 20% lithium-carbonate move is a multi-million-dollar line item. The single biggest cost-risk lever in a semi-solid program is how much of each metal you carry and how you contract it.
- Nickel remains the dominant exposure. Quasi-solid cathodes still lean on NMC or NCMA chemistries, so nickel volatility — not cobalt — is usually the largest risk term.
- Cobalt is the controllable one. Cutting cobalt 30–45% trims both the material line and the ethical-sourcing premium we must otherwise buffer into the bill of materials.
- Contract structure beats forecasting. We recommend fixed-volume off-take agreements for the volatile metals and multi-source qualification so no single supplier can impose an 8–12% scarcity premium.
- Build the custom battery solution discipline upstream. Standardizing on one cell format and one electrolyte precursor lets a buyer aggregate volume and negotiate from a stronger position.
The point is not to chase the lowest spot price; it is to reduce the variance the finance team must reserve against. A lithium battery program with stable input costs is cheaper to finance than one with a cheaper but volatile bill of materials.
The Manufacturing Scale Curve (Wright’s Law)
Battery cost obeys a learning curve: every cumulative doubling of production tends to cut unit cost by 18–24%. We model a 21% slope for semi-solid lines. The catch is that the slope only pays if your line is actually loaded. A gigafactory running at 40% utilization carries 25–35% higher allocated overhead than one at 85%. For any EV pack quote, the first question I ask a customer is not “what is your cell cost?” but “what is your line loading in 24 months?”
This is where semi-solid holds a structural advantage over true solid-state. Because the quasi-solid process reuses existing Li-ion coating and assembly lines at 0.9–1.1× capex, the capital hurdle is low. A genuinely solid-state line, by contrast, typically needs 2.0–3.5× the capital. Less solvent in the electrode also means faster drying and higher coating yield — we see first-pass yield climb from about 91% to 96% as solvent load drops, and that single percentage point is worth more than most “cheaper cathode” tweaks.
The same learning-curve discipline we apply to high-rate drone battery programs applies here: commit to a volume ramp, keep the line full, and let Wright’s Law do the work rather than chasing per-cell material savings that evaporate at low utilization.
Design-for-Cost Architecture Trades
The third lever is architectural, and in my experience it is the most under-used. Because a quasi-solid electrolyte raises thermal-runaway onset temperature by 30–50°C, you can safely shrink the safety envelope: thinner enclosures, smaller vent volumes, and less ceramic barrier material. That alone removes 6–10% of pack mass and a comparable share of cost.
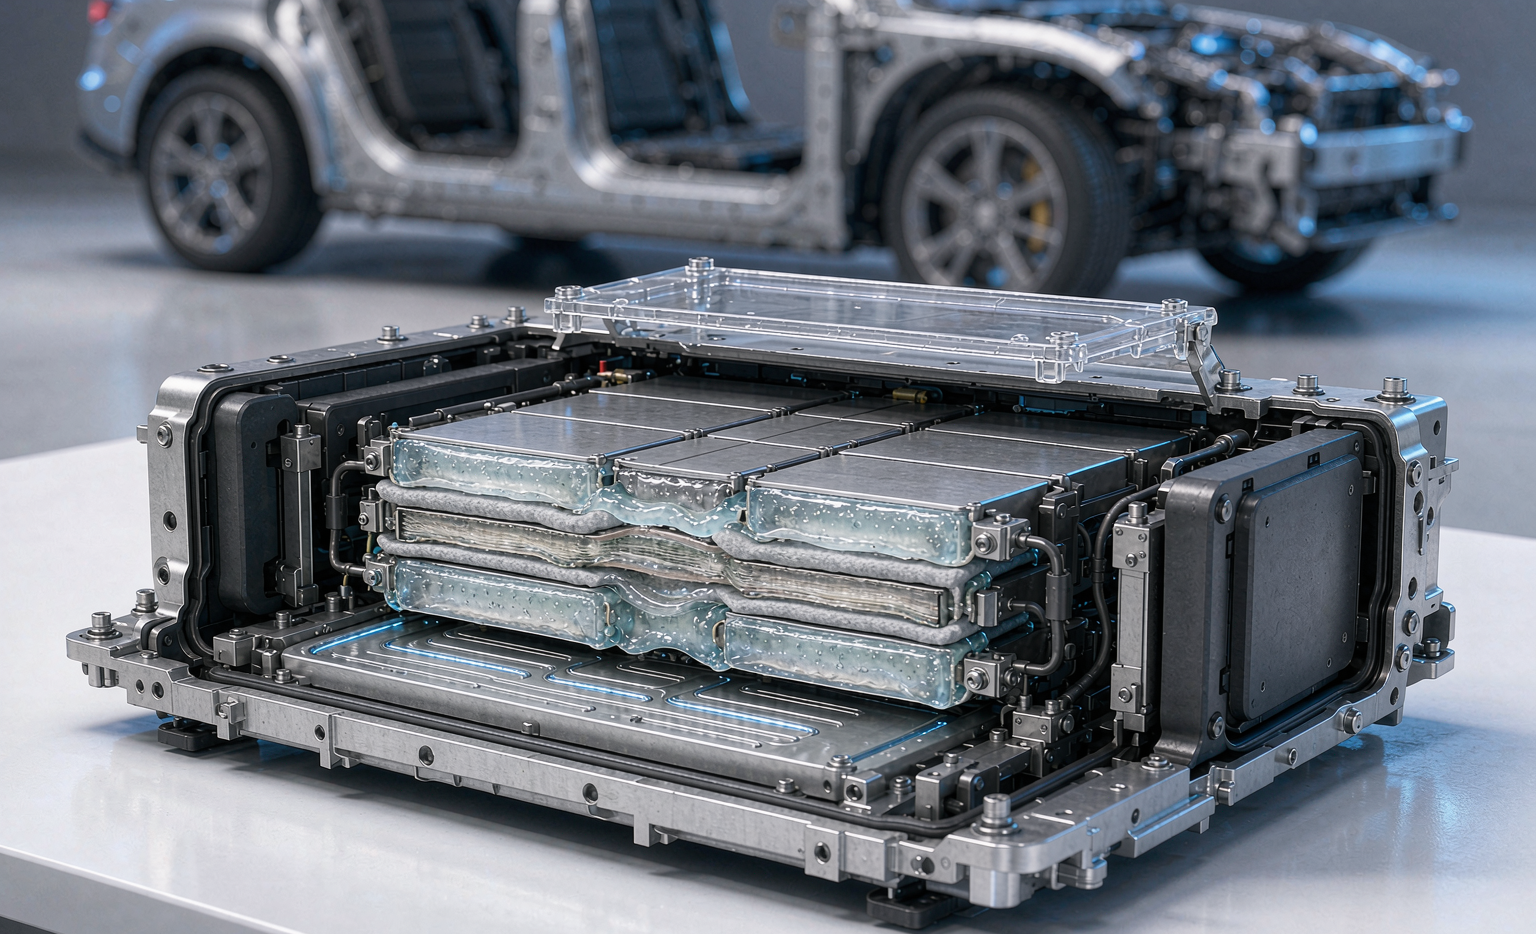
Going cell-to-pack (CTP) with prismatic cells removes the entire module tier. In a 90 kWh reference design we move from roughly 720 cells buried in modules to about 96 large prismatic cells directly bonded into the pack — cutting housing, busbar count, and assembly labor. Thanks to a 220–260 Wh/kg pack-level density, the same energy needs about 27% fewer cells than a liquid equivalent, which cascades into fewer welds, fewer sense wires, and a simpler BMS with fewer channels. Each removed part is a removed cost and a removed failure mode.
Warranty Reserve and Second-Life Value Offset
The last lever is the one finance teams consistently underestimate: degradation-adjusted cost. A semi-solid state battery shows slower calendar fade and a higher cycle count (800–1500 cycles to 80% state-of-health), which means a lower warranty-reserve accrual per kWh-year. We typically book 12–18% less reserve than for an equivalent liquid pack. That saving never appears on a sticker “$/kWh” quote, but it is real cash on the balance sheet.
Then there is residual value. At end of vehicle life the pack often retains 70–80% capacity and is directly saleable into stationary storage. Designing for second-life — single chemistry, screw rather than glued assembly, and a DataMatrix genealogy on every cell — adds a 3–6% first-life cost but recovers 8–12% at resale. Over a fleet, that flips the economics from “cost” to “asset with a second market.”
A Procurement Scorecard
A buyer should never compare two semi-solid quotes on sticker $/kWh alone. We hand our OEM customers a five-point scorecard:
- Request cost-per-usable-kWh over the full warranty window, not nameplate cost.
- Ask for coating and laser-weld CpK and yield data — a 96% line is structurally cheaper than a 91% line.
- Demand the supplier’s committed scale ramp; price is a function of utilization.
- Confirm second-source qualification status for the cathode and electrolyte.
- Pin down residual-value assumptions for second-life stationary use.
And hold the line on the standards baseline — UN38.3 T.1–T.8, IEC 62133-2, IEC 62619, GB 38031, ECE R100, UL 2580, IATA Section II, and FAA-EASA transport evidence. A pack that fails qualification is not “cheap”; it is a liability that will stop a vehicle program. The custom battery solution we deliver is engineered to clear all of them on the first pass, which is itself a cost-avoidance item.
Frequently Asked Questions
How much cheaper is semi-solid than solid-state today?
At pilot scale, semi-solid cells run roughly 30–50% below a comparable oxide solid-state cell because we reuse liquid-line equipment. We expect that gap to hold through 2030, narrowing only as true solid-state lines mature.
Does lower cobalt really lower cost risk?
Yes, but indirectly. Cobalt’s absolute price matters less than its volatility and ethical-sourcing premium. Cutting cobalt 30–45% trims both the material line and the supply-risk buffer we must carry, which stabilizes the landed cost.
What production scale do I need for competitive pricing?
For a CTP prismatic program we see cost crossover versus liquid NMC around 4–6 GWh cumulative output. Below that, plan on an 8–15% premium; above 10 GWh, semi-solid is often at parity or below a liquid equivalent.
Can I reuse my existing Li-ion pack assembly line?
Largely yes for pack-level integration — the enclosure, BMS, and thermal hardware are chemistry-agnostic. Cell formation and coating need modest retooling, but capex is 0.9–1.1× of a liquid line, not a greenfield build.
How do I compare two semi-solid quotes apples-to-apples?
Normalize to cost-per-usable-kWh over the full warranty, include warranty reserve and residual value, and require identical standards evidence. A 5% lower sticker can become a 10% higher landed cost once degradation and qualification risk are counted.