Semi-Solid State Battery Cost Optimization for Storage
Every stationary storage RFQ that lands on my desk starts with the same sentence: “We like the safety story of semi-solid, but the price has to work.” After a decade of building lithium battery packs and running cost-down programs on the factory floor, I can tell you that semi-solid state battery cost optimization for storage is not a materials problem you solve once. It is a stack of ten or twelve engineering decisions, each worth $2 to $15 per kWh, that either compound in your favour or quietly destroy the business case.
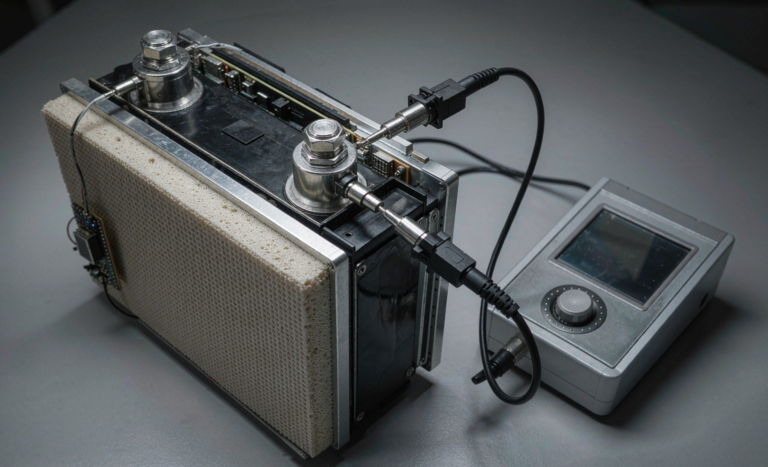
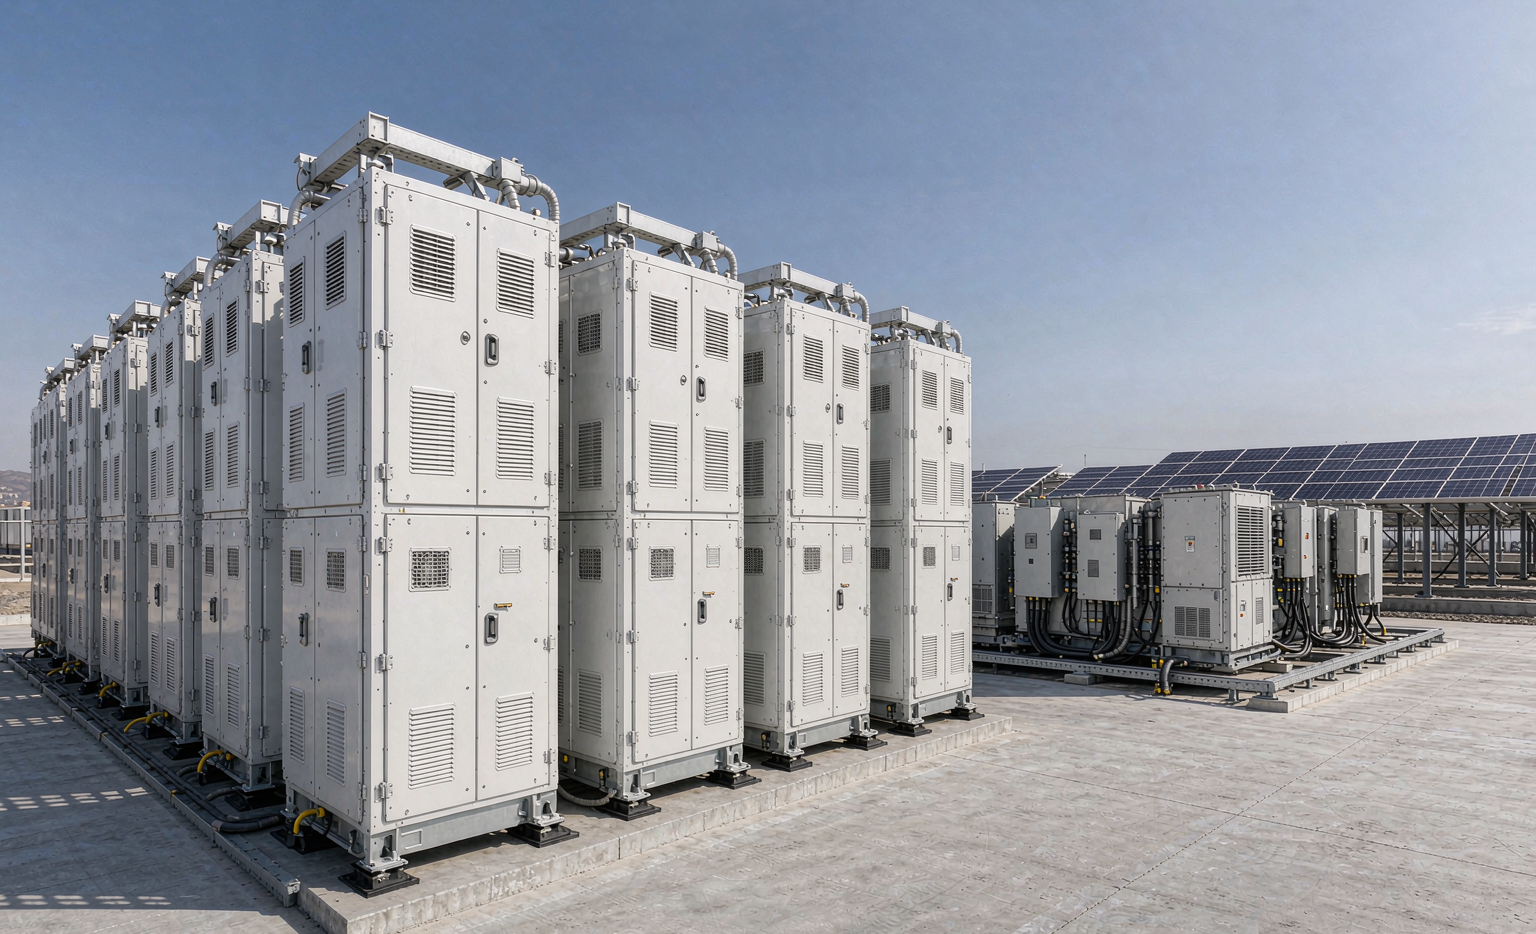
This article is the teardown I normally walk customers through before we quote a stationary project. I will use the same numbers my team uses in internal cost models, explain where a semi-solid state battery genuinely costs more than a conventional cell, and show which levers actually move the needle when your product is a 100 kWh cabinet that has to survive twenty years on a concrete pad.
Why Stationary Storage Rewrites the Semi-Solid Cost Equation
In aviation and robotics work, we pay a premium for gravimetric energy density because every gram is billed. Stationary storage flips that logic. A cabinet sitting on the ground does not care about 15 Wh/kg. What it cares about is installed cost per usable kWh, degradation over 6,000+ cycles, footprint per MWh, and whether the fire marshal signs off on the installation.
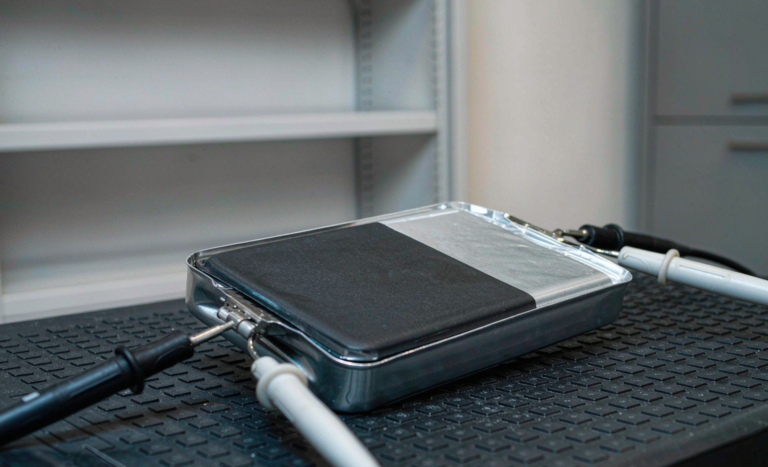
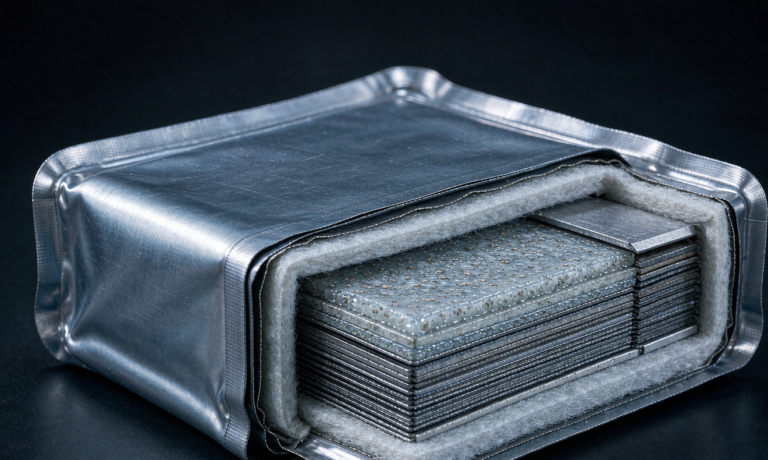
That reordering of priorities is why semi-solid chemistry can win here even when the raw cell price is higher. A semi-solid state battery uses a gelled or partially solidified electrolyte instead of a fully liquid one, which lets us push thicker electrodes and reduce the amount of free flammable liquid inside the jelly roll. On a cell datasheet, that shows up as slightly lower power capability. On a project cost sheet, it shows up as fewer cooling components, relaxed spacing requirements, and less money spent on fire suppression engineering.
My working baseline in 2026 for stationary formats: conventional prismatic LFP cells land around $58 to $75 per kWh at real volume, while comparable semi-solid state cells sit at $88 to $125 per kWh depending on separator and electrolyte sourcing. That is a 40 to 70 percent cell-level premium. The entire optimization exercise is about clawing that back at the pack, system, and lifetime level — and shrinking the cell gap itself through process work.
BOM Teardown: Where the Money Actually Sits
When I break down a semi-solid stationary cell into cost buckets, the distribution looks roughly like this for a 280 to 340 Ah prismatic format:
- Cathode active material (LFP or LMFP): 32–38%. Same commodity exposure as any lithium battery. Nothing exotic here, and this is where volume purchasing matters more than clever engineering.
- Gel / quasi-solid electrolyte system: 11–17%. Versus 6–9% for a conventional liquid electrolyte. The polymer precursor, ceramic filler, and initiators are the single biggest structural cost adder.
- Anode (graphite or graphite-Si blend): 10–14%. Silicon content above about 6% starts adding swelling management cost that a stationary product rarely needs.
- Separator: 6–10%. Semi-solid designs often allow a thinner or cheaper separator because the gel contributes mechanical and thermal stability. This is a real and frequently missed saving.
- Current collectors, can, terminals, tabs: 9–12%. Format-driven. Larger cells amortize hardware over more kWh.
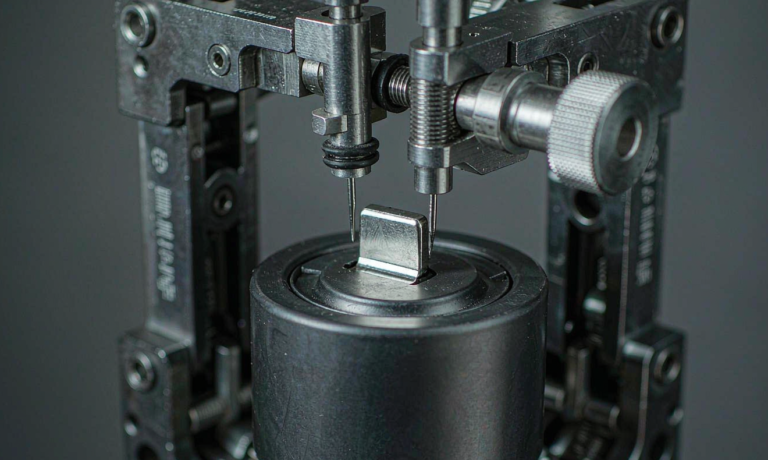
- Manufacturing conversion cost (coating, calendering, injection, curing, formation): 14–22%. This is the bucket where semi-solid production loses the most ground today, and the bucket engineers can most directly attack.
Two conclusions follow immediately. First, chasing cathode price alone is a losing game because everyone in the industry buys from the same suppliers at similar terms. Second, the semi-solid premium is concentrated in electrolyte formulation and conversion cost, which means most of your cost-down budget should go into process engineering, not into renegotiating cathode contracts.
Process Cost: Gel Injection, Curing, and Yield
The uncomfortable truth about semi-solid manufacturing is that a conventional lithium battery line runs at 96 to 98 percent yield after ramp, while early semi-solid lines commonly sit at 88 to 93 percent. Every yield point below your competitor is roughly $1.0 to $1.6 per kWh of pure loss on a $100/kWh cell. I have seen programs where fixing yield delivered more savings than an entire year of materials negotiation.
The specific levers we work on:
- Injection viscosity window. Gel precursors are far more viscous than liquid electrolyte. Holding the precursor within a tight temperature band during injection — typically 38 to 45 °C in our process — cuts incomplete wetting defects dramatically. Poor wetting shows up later as high self-discharge and DCIR scatter, and those cells fail grading, not incoming inspection.
- Curing time and oven throughput. Thermal curing is a hard takt-time constraint. Moving from a 6-hour batch cure to a staged 2.5-hour profile with a controlled ramp raised our line output per oven footprint by roughly 2.2x. Capital productivity is a cost lever even when unit materials do not change.
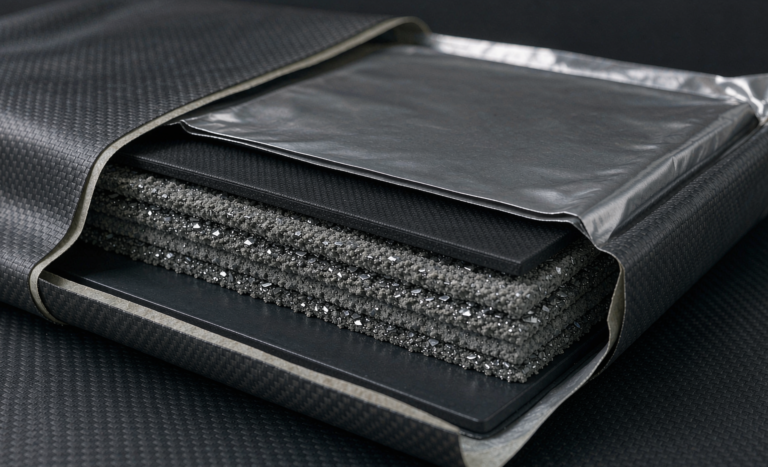
- Thick-electrode calendering. Semi-solid tolerates thicker electrodes — 4.5 to 6.5 mAh/cm² versus about 3.0 to 3.8 mAh/cm² for a conventional cell. Fewer layers per cell means less separator, less foil, and fewer welds. Done properly, this alone recovers $6 to $11 per kWh.
- Formation and aging time. Formation is electricity plus floor space plus working capital. Compressing an 18-day aging protocol to 9 days, validated against K-factor self-discharge data (we require below 1.0 mV/day at 25 °C), releases meaningful inventory cost.
None of this is glamorous. All of it is where a semi-solid state battery pack becomes affordable.
Pack-Level Levers: Thermal, Enclosure, and Parts Count
Here is where semi-solid pays you back. Because the electrolyte is gelled and the cell’s thermal runaway onset typically sits 20 to 40 °C higher than a comparable liquid-electrolyte cell, we can design the pack with fewer defensive components:
- Cooling architecture. Many stationary duty cycles run at 0.25C to 0.5C. With semi-solid cells and thick electrodes, we have delivered several 100 kWh cabinets on forced-air cooling where the liquid-electrolyte equivalent needed a liquid cold plate loop. Deleting the pump, manifold, coolant, and leak-detection logic saves $9 to $16 per kWh and removes an entire failure mode from the O&M budget.
- Inter-cell spacing and mica sheeting. Propagation testing per UL 9540A often permits thinner barriers when cell-level runaway energy is lower. Reclaimed volume becomes either more kWh in the same cabinet or a smaller enclosure — both are cost.
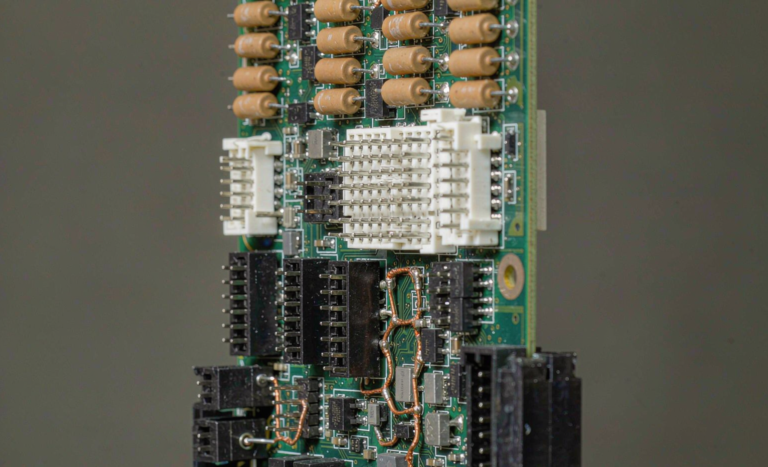
- Module granularity. Larger modules mean fewer BMS slave boards, fewer connectors, and fewer harnesses. Connectors are a chronically underestimated cost and reliability line item; on one project we removed 34 connector pairs per cabinet and cut both cost and warranty claims.
- Structural integration. Using the module wall as part of the cabinet’s load path saved us 11 kg of steel per module. Steel is cheap, but touch labour is not.
Add these up honestly and the 40 to 70 percent cell premium typically narrows to a 12 to 25 percent premium at delivered-system level. That is the number a customer should be comparing, and it is the number I put in front of procurement teams who only look at cell quotes.
LCOS Math: Why $/kWh-Cycle Beats $/kWh
Every serious storage buyer should evaluate a custom battery solution on throughput cost, not sticker price. The simplified relationship I use in first-pass modelling is:
Cost per delivered kWh ≈ Installed $/kWh ÷ (cycles to end-of-life × usable depth of discharge × round-trip efficiency)
Run two realistic cases. A conventional LFP system at $118/kWh installed, 4,500 cycles to 80% state of health, 90% DoD, 91% round-trip efficiency yields about $0.032 per delivered kWh. A semi-solid system at $142/kWh installed, 7,200 cycles, 92% DoD, 93% RTE yields about $0.023 per delivered kWh. The semi-solid option is 20 percent more expensive to buy and roughly 28 percent cheaper to operate over its life.
Two caveats I always state explicitly. First, cycle-life claims must come from your own accelerated data at realistic temperature, not from a supplier’s 25 °C laboratory curve — calendar fade at 35 °C ambient can erase the advantage. Second, if the application only cycles 200 times per year, lifetime advantages discount away and a cheaper conventional lithium battery is the correct engineering answer. I have recommended exactly that to customers whose duty profile did not justify the premium.
Qualification and Compliance Costs You Must Budget
Cost models that ignore certification are fiction. For a stationary semi-solid programme, plan for:
- UN 38.3 (T.1–T.8) for transport, including altitude, thermal cycling, vibration, shock, external short, impact, overcharge, and forced discharge. Large-format cells frequently need the T.4 fixture redesigned, which costs schedule as much as money.
- IEC 62619 for industrial secondary lithium cells and batteries, plus IEC 62620 where applicable. For smaller residential packs, IEC 62133-2 still governs.
- UL 1973 for stationary battery systems and UL 9540 / UL 9540A for energy storage systems and thermal runaway propagation characterization. UL 9540A testing is expensive but it is exactly where semi-solid chemistry earns permitting concessions under NFPA 855.
- Shipping at 30% state of charge under UN3480 rules, which affects your production scheduling and warehouse turnover.
Budget $120k to $280k and six to nine months for a full stationary certification package on a new cell format. Amortized across a 200 MWh pipeline, that is under $1.5 per kWh — trivial. Amortized across a 5 MWh pilot, it is $50 per kWh and it will sink the project. Certification strategy is cost strategy.
A Practical Cost-Down Roadmap
When we take on a new stationary programme, the sequence I follow is deliberately ordered by return on engineering hours:
- Months 0–3: format and electrode design. Choose the largest cell format your safety case and thermal model support, and push areal loading to the highest value your rate requirement allows. Biggest single lever.
- Months 2–6: process yield. Attack injection wetting, cure profile, and grading criteria. Target 95%+ before volume ramp.
- Months 4–9: pack simplification. Delete liquid cooling if the duty cycle allows, consolidate modules, cut connector count, integrate structure.
- Months 6–12: certification and permitting leverage. Use UL 9540A propagation results to negotiate spacing and suppression scope, converting safety margin into installed-cost savings.
- Ongoing: supply localization. Second-source the polymer precursor and ceramic filler. Single-sourced electrolyte chemistry is the most common reason a promising semi-solid programme stalls at price parity.
One cross-domain note worth making: the electrode and electrolyte know-how developed for high-cycle stationary work transfers directly into our high-drain products, including drone battery packs where thermal stability under sustained 8C discharge matters more than cost. Standards such as FAA and EASA transport rules push the same design discipline from the opposite direction — mass and abuse tolerance instead of dollars per kWh. Teams that run both product lines learn faster than teams that run only one.
Frequently Asked Questions
Is a semi-solid state battery cheaper than LFP for home or grid storage today?
Not at the cell level. Expect a 40 to 70 percent cell premium in 2026. At delivered-system level the gap narrows to roughly 12 to 25 percent, and on a cost-per-delivered-kWh basis over life, semi-solid usually wins when the system cycles more than about 350 times per year. Below that threshold, conventional LFP is generally the rational choice.
What is the single most effective cost lever?
Electrode thickness combined with cell format. Moving from 3.4 mAh/cm² to 5.5 mAh/cm² in a larger prismatic can removes separator area, foil, tabs, welds, and assembly steps simultaneously. In our models it delivers more savings than any materials negotiation available to a mid-sized manufacturer.
Does semi-solid chemistry really reduce cooling cost?
Yes, when the duty cycle is moderate. At 0.25C to 0.5C continuous, we have replaced liquid cold plates with engineered forced-air paths on multiple stationary builds. At 1C or above, or in 45 °C ambient enclosures, you will still need liquid cooling — do not let a sales deck talk you out of a thermal simulation.
Which certifications apply to a stationary semi-solid system?
UN 38.3 for transport, IEC 62619 for industrial cells and batteries, IEC 62133-2 for smaller residential packs, UL 1973 for the stationary system, and UL 9540 / UL 9540A for the ESS and thermal runaway propagation, with installation governed by NFPA 855 in North America. Plan six to nine months for a new format.
How should I validate supplier cycle-life claims?
Require raw cycling data at your actual temperature, C-rate, and depth of discharge, then run your own accelerated calendar-fade test at elevated temperature for a minimum of 90 days. We gate every custom battery solution on in-house data before it appears in a customer LCOS model, because supplier 25 °C curves routinely overstate field life by 20 to 35 percent.
Can existing lithium battery production lines be converted?
Partially. Coating, calendering, and assembly equipment largely carries over. Electrolyte injection and curing require new tooling, and formation and aging protocols must be re-derived. Realistic conversion capex is 15 to 30 percent of a greenfield line, which is why brownfield conversion is usually the fastest path to competitive semi-solid pricing.
If you are scoping a stationary programme and want a candid view of where your cost model is optimistic, my team is happy to review the assumptions. We have made most of these mistakes already, and the cheapest engineering hours are the ones you spend before tooling is ordered.
Karl Huang, Senior Lithium Battery Engineer, Horizon Power