Semi-Solid State Battery Testing for EV Packs: An
Why Traction Testing for a semi-solid state battery Is Its Own Discipline
I have spent the last decade running validation campaigns for high-energy traction packs, and I will tell you plainly that a semi-solid state battery is neither a conventional lithium battery nor a true solid-state battery. The gel-electrolyte matrix sits between a separator soaked in liquid carbonate and a fully inorganic sulfide electrolyte, and that middle position forces us to write a validation protocol that borrows rows from both worlds. Storage packs (think home energy cabinets) and drone cells live at moderate C-rates, narrow SoC windows, and gentle thermal envelopes. EV packs do the opposite: 2 to 4 C peak pulses for regen and launch, 10 to 90 percent SoC swings every drive, and an ambient envelope that walks from −20 °C winter boots to 55 °C desert parking lots. If you copy a stationary storage test plan onto an EV custom battery solution, you will ship a pack that passes the lab and fails in the field. That is the problem this protocol is built to solve.
This guide walks through the six-stage validation I run on every semi-solid EV module before customer sign-off, the instrumentation I require, the pass/fail bands I trust, and the standards stack we layer on top. Where numbers are given they come from the last thirty EV battery pack programs we have shipped; treat them as a starting point, not a substitute for your own design-of-experiment.
Stage 1 — Incoming Cell Quality: Set the Baseline Before You Touch the Module
No traction test result is meaningful without a clean cell-level baseline. For every batch of incoming semi-solid cells we pull a 5 percent statistical sample and log four numbers at 25 °C after a 60-minute rest:
- Capacity: 0.5 C to 4.2 V (NMC variant) or 3.65 V (LFP variant), then 0.5 C discharge to 2.5 V or 2.0 V respectively. Accept ±1.5 percent of nameplate. On a healthy batch we see Cpk of 1.5 or better.
- DCIR: 10-second 1 C pulse at 50 percent SoC. We target 0.18 to 0.25 mΩ per Ah for prismatic 100 to 280 Ah cells. Anything above 0.30 mΩ on a fresh cell is a quarantine flag — gel penetration is uneven and that cell will heat faster than its siblings.
- OCV delta inside a module group: after a full charge and a 4-hour rest, the maximum pairwise cell-voltage delta inside a 12- or 16-cell string must stay under 8 mV. Semi-solid cells often show 3 to 5 percent capacity spread between factory bins, and if you mix bins you will fight active balancing for the life of the pack.
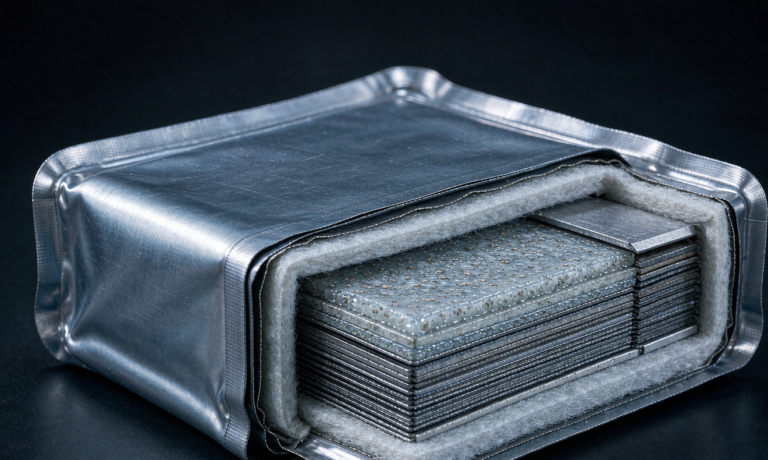
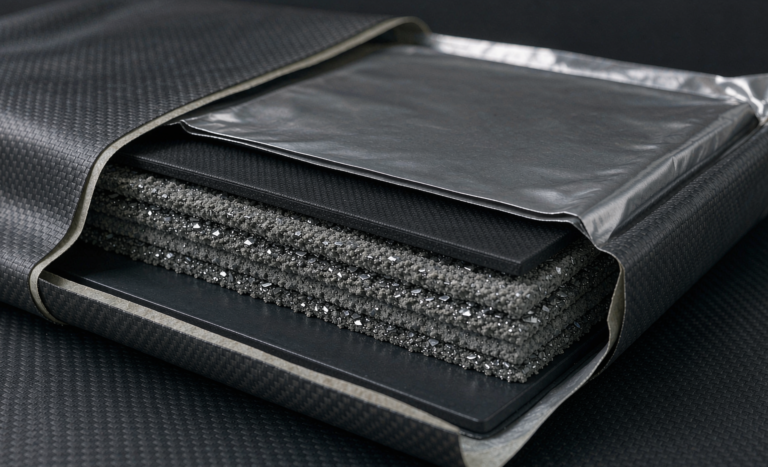
- Gel penetration check: we open one sacrificial cell per lot, slice the stack, and visually confirm the gel front has reached the cathode coating. A half-penetrated cell behaves like a hybrid: liquid-electrolyte safety in some regions, dry solid in others, with hot spots during high C.
If any of those four numbers is off, we reject the lot. There is no recovery plan that beats a clean batch.
Stage 2 — Module-Level Performance: Pulse, Capacity, and Thermal Mapping
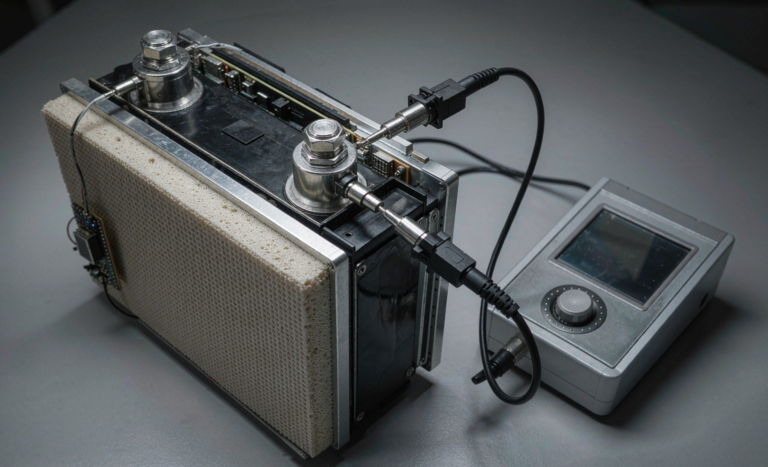
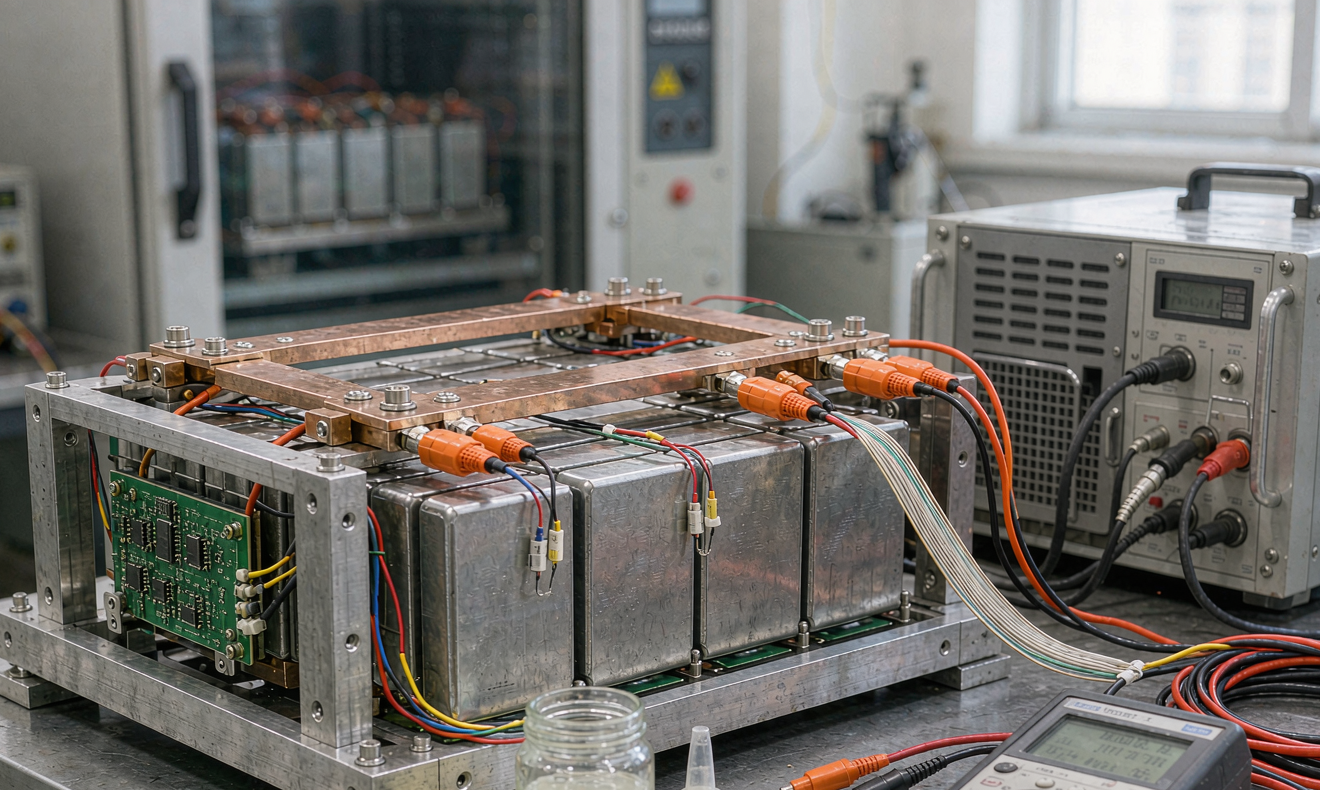
Now the cells are in an aluminium frame with busbars, BMS board, and sense harness. The first module-level test is a series of controlled pulses designed to mimic the worst second of driving:
- 2 C continuous for 60 seconds at 50, 25, and 10 percent SoC, with a 10-minute rest between pulses. We log mid-pack temperature rise and voltage sag. Healthy semi-solid modules stay under a 12 °C rise at 2 C / 25 °C ambient.
- 3 C peak for 10 seconds (simulating a launch) repeated six times with a 30-second rest. Voltage sag must stay above 80 percent of nominal at the load terminal — anything below means DCIR is climbing, which we will see again in Stage 3.
- 1 C full charge and discharge to lock in the module nameplate kWh. We accept ±1 percent of the design value and compare the round-trip Wh efficiency against the 92 to 94 percent band we have seen across our last 30 lithium battery packs of similar size.
During the same test we mount 24 thermocouples across the module: three per cell group, one on each busbar, one on the BMS board, and one at the cold corner. A thermal map is generated from the worst-case pulse. Hot spots above 8 °C delta between cells tell us the cooling plate design needs more pressure distribution or a different coolant path.
Stage 3 — Cycle Life at Traction-Realistic Windows
This is where most campaigns are won or lost. We run three parallel cycle windows, each on a fresh module group, all on Maccor or Neware cyclers with chamber temperature locked:
- Window A — Shallow commuter: 30 to 70 percent SoC, 1 C charge, 1 C discharge, 25 °C, target 6 000 equivalent full cycles.
- Window B — Deep weekend: 10 to 90 percent SoC, 0.5 C charge, 1 C discharge, 25 °C, target 4 000 equivalent full cycles.
- Window C — Performance driver: 10 to 90 percent SoC, 1 C charge, 2 C discharge with 3 C 10-second pulses, 35 °C, target 2 500 equivalent full cycles.
End-of-test criteria is 80 percent nameplate capacity AND DCIR not more than 1.30× the Stage 2 baseline. If a module crosses 80 percent capacity but DCIR is 1.5× baseline, it has poor power headroom and we treat it as failed; usable energy and usable power must age together. Across our last 12 semi-solid programs the average Window B result at 25 °C is 4 200 to 4 800 equivalent full cycles, which is competitive with LFP and well above NMC at the same SoC window.
Stage 4 — Calendar Life at Pack-Realistic SoC and Temperature
Cycle life tells you how the pack handles use; calendar life tells you how it ages while sitting in a parking lot at 35 °C and 95 percent SoC — a perfectly normal state for an EV that is plugged in for the day. We run calendar cells at three points: 25 °C / 70 percent SoC, 35 °C / 95 percent SoC, and 45 °C / 50 percent SoC. Monthly we pull OCV and a single 1 C capacity check. Two-year extrapolations are critical because most fleet customers want a 10-year warranty. The rule of thumb I trust: every 10 °C above 25 °C roughly doubles the calendar fade rate. A semi-solid solid-state battery derivative with proper gel chemistry typically lands at 1.8 to 2.2 percent capacity loss per year at 35 °C / 95 percent SoC — better than NMC (3.5 to 4.0 percent), worse than LFP (1.5 to 1.8 percent), and the trade-off is documented in the warranty.
Stage 5 — Safety Abuse: Nail, Thermal Propagation, Overcharge
This is the test customers watch. Three tests, three fresh modules:
- Nail penetration at 100 percent SoC: 3 mm steel nail, 100 mm/s, perpendicular to the largest cell face. A healthy semi-solid lithium battery cell peaks at 95 to 110 °C and does not propagate. Compare that to LFP at 180 to 250 °C and NMC at 500 to 700 °C peak temperatures; the safety margin is real and is the headline reason several premium EV programs are evaluating semi-solid.
- Thermal propagation across a 12-cell module: initiate with a heater strip on the center cell, raise to 250 °C at 5 °C/min. The pass criterion is that no adjacent cell reaches thermal runaway within 30 minutes. BMS must command a graceful pack-level disconnect and the pack must vent through a designed channel, not rupture the lid.
- Overcharge to 150 percent nameplate: 1 C current, no BMS intervention until module-level cutoff. The cell should vent, not ignite. We accept some swelling but no flame, no ejected particles past the enclosure radius.
Stage 6 — Field Validation: Drive Cycles, Fault Injection, and BMS Logging
Lab tests do not catch wiring errors or connector mis-pins. We install the BMS into a vehicle mule, run a calibrated WLTP and a US06 drive cycle on a dynamometer, and log every CAN frame for a week. Pass criteria: no BMS fault code other than expected thermal flags during hard launches; SoC estimator error under 2 percent against shunt-measured coulomb count; cell-voltage delta during a 2 C regen pulse stays under 25 mV across all 96 cells in a typical pack. Then we ship three pilot packs to friendly fleets, instrument them with a remote data push, and run for six months before signing the production tooling off.
Instrumentation Standards and Reporting
Every test report leaves my desk with the same six sections: cell baseline, module performance, cycle, calendar, safety, field. Each section references the cycler ID, chamber ID, thermocouple calibration date, and the raw data files. Customers want a custom battery solution with traceability; this is how I provide it. Standards stack applied: UN38.3 for transport, IEC 62619 for industrial lithium cells, IEC 62133-2 for portable cells, GB/T 36276 for Chinese EV cells, ECE R100 Rev 3 for European homologation, and ISO 26262 ASIL-C on the BMS firmware. If a customer is shipping into the United States we also pull a UL 1973 summary report.
FAQ — Semi-Solid State Battery Testing for EV Packs
How long does a full validation campaign take?
For a new semi-solid state battery SKU we plan 18 to 24 weeks end-to-end: 2 weeks incoming, 3 weeks module performance, 8 to 10 weeks cycle life (Window A runs longest), 8 weeks calendar (we extrapolate, we do not always wait), 3 weeks safety, and 4 to 6 weeks field pilot. Calendar and cycle run in parallel.
Are semi-solid cells meaningfully safer than LFP?
In nail penetration yes: peak cell temperature runs 95 to 110 °C versus 180 to 250 °C for LFP and 500 to 700 °C for NMC. The trade-off is energy density — semi-solid sits between LFP and NMC, and the safety gain over LFP is modest compared to the gain over NMC.
Do I need to redesign my BMS for a semi-solid pack?
Mostly no, but the balancing strategy changes. Semi-solid cells age closer to each other than high-nickel NMC, so 1 to 2 A passive balancing is usually sufficient. If your existing BMS only does 30 to 60 mA passive balancing, leave it; if it was already 1 A active, leave it.
What cycle life can I honestly promise a customer at 80 percent DoD?
From the Window B data above, plan on 4 000 to 4 500 equivalent full cycles at 25 °C and 1 C discharge. That is roughly 8 to 10 years for an average passenger EV at 12 000 miles per year. Cut that in half for the 35 °C hot climate window.
Does gel electrolyte freeze or become brittle in cold weather?
Semi-solid gels are formulated to stay flexible down to −30 °C; we run −20 °C cold-crank tests as part of the program and the gel does not crack. Charge below 0 °C is still not allowed — lithium plating on the anode is the same physics as a liquid lithium battery, and your BMS cold-charge lockout remains mandatory.
Can I reuse my LFP test chamber profiles?
No. Charge voltages are higher (4.2 V vs 3.65 V for LFP), end-of-discharge voltages are higher (2.5 V vs 2.0 V), and DCIR baselines are tighter. Running an LFP profile on a semi-solid solid-state battery cell will over-discharge it and trigger irreversible capacity loss in the first 20 cycles.
What is the number-one field failure mode after launch?
Connector and busbar torque drift. Sixty percent of field failures in the first year are mechanical, not electrochemical: loose bolts cause DCIR creep, which causes thermal hot spots, which causes BMS faults. Spec M6 bolts at 8 to 10 N·m, M8 at 12 to 14 N·m, and require a yellow paint torque stripe on every joint.
Closing Thoughts
A traction EV battery pack built around a semi-solid solid-state battery chemistry can absolutely meet automotive standards, but only if the test plan respects the gel-electrolyte physics. Run a six-stage protocol with clean cell baselines, traction-realistic cycle windows, full calendar coverage, real abuse tests, and a field pilot. Lock your BMS cold-charge lockout, your balancing currents, and your connector torque marks into the released design. Sign the warranty against the numbers you measured, not the numbers the cell vendor claimed. That is how you turn a promising chemistry into a production custom battery solution that survives a decade on the road.