Sodium-Ion Battery Cycling Test Protocols Guide
Why Standardized Cycling Tests Matter for Sodium-Ion Batteries
When I started qualifying sodium-ion cells for stationary storage at Horizon Power, the first thing I noticed was how inconsistent vendor cycle-life numbers were. One supplier claimed 4,000 cycles at 80 percent capacity retention, another quoted 3,000 under what looked like the same conditions. The gap was not the chemistry. It was the test protocol. A sodium-ion battery cycling test protocol is the repeatable set of rules that defines how a cell is charged, discharged, held, and measured so that two laboratories can compare results on the same footing. Without it, capacity retention numbers are marketing, not engineering.
The core of any protocol is defining the stress you apply and the reference you measure against. Stress comes from temperature, C-rate, depth of discharge, and cut-off voltages. The reference is a low-rate capacity check performed under fixed conditions, usually 0.2C at 25 degrees Celsius, that reveals how much usable capacity the cell has lost. For sodium-ion, this matters more than for lithium-ion because the hard carbon anode and the wider spread of commercial cathode chemistries make fading behavior chemistry-specific.
Core Test Conditions: Temperature, C-Rate, and Voltage Window
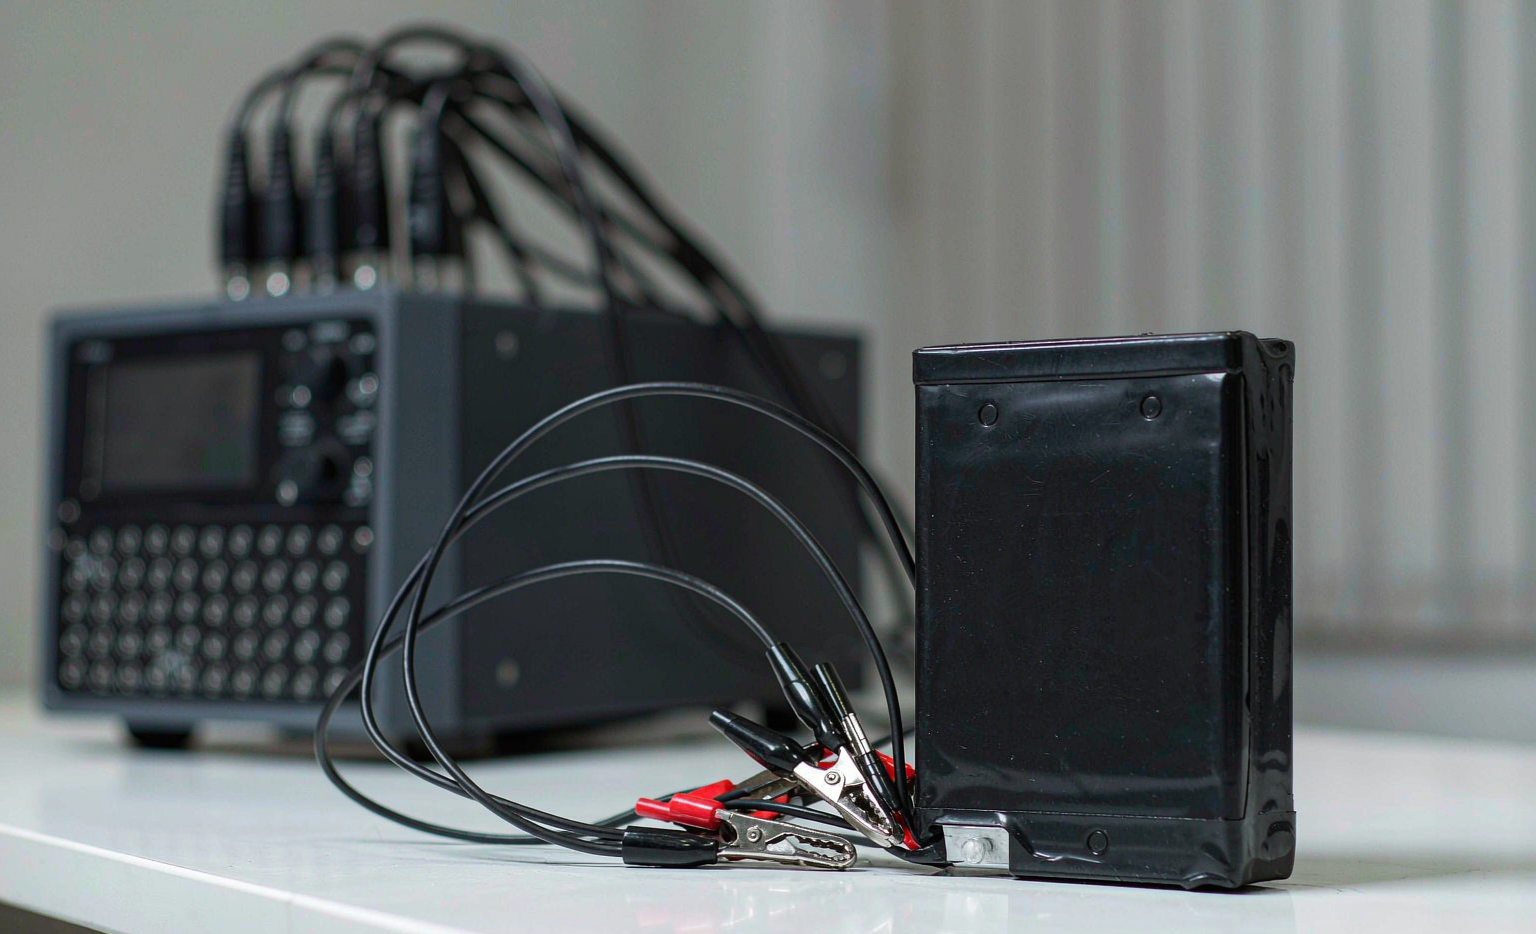
Every cycling test begins with three fixed inputs. Temperature is normally 25 degrees Celsius for the baseline, with extended campaigns at 0, 45, and sometimes 55 degrees Celsius to map acceleration. C-rate defines the current relative to nominal capacity: 1C charges or discharges the cell in one hour. Characterization uses 0.2C to 0.5C so that polarization does not hide true capacity, while life testing of power cells runs at 1C to 3C.
Voltage window is where sodium-ion diverges by chemistry. A layered oxide cathode paired with hard carbon commonly cycles between 1.5 V and 4.0 V, with a nominal around 3.1 V to 3.2 V. A polyanionic cathode such as sodium iron phosphate operates in a lower window, roughly 2.5 V to 3.8 V. Setting the wrong cut-off during a sodium-ion battery cycling test protocol can either strand capacity or drive the hard carbon into a region that accelerates fade. We log the window in the test report and hold it to plus or minus 10 mV across channels.
Depth of discharge is the third stress lever and it interacts with the window. A 100 percent depth of discharge test ages a cell far faster than an 80 percent window, so the protocol must state the discharge cut-off and whether the upper cut-off is reached by constant current or constant voltage taper. We also define rest periods between charge and discharge, usually 30 minutes, because a sodium-ion cell recovers voltage as the hard carbon relaxes and skipping the rest inflates the next capacity reading. Small details like these are exactly why a written protocol beats an informal test bench routine.
Capacity Retention Measurement and the 80 Percent Threshold
Capacity retention is the single metric buyers ask about, and the one most often misread. It is calculated as the measured reference capacity at cycle N divided by the beginning-of-life capacity, expressed as a percentage. The reference capacity must be taken at the same low rate and temperature every time, or the curve becomes noisy.
In our laboratory we classify 80 percent retained capacity as the typical end-of-life threshold for stationary applications, matching common warranty language and references such as IEC 62619 and UL 1973. Some residential systems accept 70 percent. The useful number is not the headline cycle count but the cycle count at the chosen threshold under the duty profile the customer will actually run.
Capacity is not the whole story. We pair it with direct current internal resistance measured by a short high-current pulse at the same reference state. Resistance growth of more than 50 percent usually signals a cell that will trip protection limits long before its capacity hits threshold. Round-trip efficiency, measured as energy out divided by energy in over a full cycle, gives the system designer the loss they must oversize for. Reporting all three together prevents a cell that looks fine on capacity from failing in the field on power.
Cycle Life Test Design: Formation, Conditioning, and Sampling
A credible life test has three phases. Formation uses the first one to three cycles at low rate to stabilize the hard carbon solid electrolyte interphase. Conditioning then runs a fixed break-in routine so all cells enter the test from the same state. Sampling inserts a reference performance test every 50 to 100 cycles, where the cell is returned to 0.2C at 25 degrees Celsius and its capacity and resistance are recorded.
I always test in statistical batches rather than single cells. A batch of eight to sixteen cells per condition exposes cell-to-cell variation that a lone sample hides. When one cell in a batch fails early, the protocol tells us whether to treat it as an outlier or as a signal of a process drift. This discipline is what turns a sodium-ion battery cycling test protocol from a one-off experiment into a qualification record an auditor can trust.
Environmental control is where many in-house tests fail. We run chambers at plus or minus 2 degrees Celsius and log every channel at one minute resolution so a fan failure shows up as a data anomaly, not a silent condition shift. After a cell completes its cycle budget or reaches threshold, we perform a capacity recovery check: a 24 hour rest at 25 degrees Celsius can recover one to three percent, and the protocol must state whether recovered capacity counts. We do not count it, because a storage system rarely gets that rest in service.
Calendar Aging Versus Cycle Aging
Not all fade comes from cycling. Calendar aging is the capacity lost while a cell simply sits stored at a given state of charge and temperature. For sodium-ion we store witness cells at 50 percent and 100 percent state of charge at 45 degrees Celsius and measure them periodically. The dominant mechanism at the hard carbon anode is slow interphase growth, which consumes active sites and raises internal resistance even when the cell is never cycled.
The rate of calendar fade for sodium-ion follows roughly the square root of storage time at a fixed temperature, so the early months set the slope the customer will live with for years. We choose 50 percent state of charge as the conservative storage point and 100 percent as the worst case, then fit both lines so a procurement team can read the expected ten year capacity from the chart. Picking the state of charge for the test is itself a design decision, not a default.
Separating the two matters because a storage product spends far more time idle than a power product. A protocol that only reports cycle aging understates the real loss a home or telecom buffer will see. We report calendar fade and cycle fade on the same chart so the application engineer can pick the dominant term for the duty cycle.
Data Reporting and How We Validate Cells
The protocol is only as good as the report. Our standard output includes the capacity retention curve, the direct current internal resistance trend, the round-trip efficiency at the application C-rate, and the temperature at which each test ran. Round-trip efficiency for sodium-ion today typically lands between 85 percent and 92 percent depending on cell design and rate, and we track it because a two point loss over life is a real energy penalty in a daily-cycling system.
Customers use these reports in two ways. The procurement team reads the cycle count at threshold to size the warranty reserve. The system integrator reads the resistance and efficiency curves to set the converter headroom. That is why we treat the sodium-ion battery cycling test protocol as a deliverable, not a lab formality, and why a custom battery solution for a given duty cycle starts from the test that matches that cycle rather than a catalog number.
For compliance we align test design with IEC 62619 for industrial cells, UL 1973 for stationary systems, UN38.3 for transport safety, and the Chinese national standard GB/T 43826 for sodium-ion cells where the product is built or sold. A well-documented protocol is the bridge between a chemistry on paper and a bankable capacity retention number a customer can plan around.
Choosing the Right Test Protocol for Your Application
If you are specifying cells, match the protocol to the job. A daily-cycling behind-the-meter system should be qualified at 1C with 80 to 90 percent depth of discharge and calendar aging at the float state of charge it will actually hold. A backup or telecom buffer that sits idle most of the time needs a heavier calendar-aging campaign and lighter cycle testing. A high-power starter or lifting duty wants 3C to 5C life testing even if the headline capacity looks lower. Asking a supplier for the sodium-ion battery cycling test protocol behind their claim is the fastest way to separate a qualified cell from a hopeful one, and it is the first question our engineering team puts to any new chemistry we consider.
What is a sodium-ion battery cycling test protocol?
It is a fixed, repeatable procedure that defines the temperature, C-rate, voltage window, and measurement method used to cycle a sodium-ion cell and track how its capacity fades over time.
How is capacity retention calculated for sodium-ion cells?
Divide the cell’s reference capacity measured at a fixed low rate and temperature at cycle N by its beginning-of-life capacity, then express the result as a percentage. Using a consistent reference condition is what keeps the number meaningful.
What C-rate is used in standard cycle life testing?
Characterization and reference checks use 0.2C to 0.5C to avoid polarization, while life testing runs at the application rate, often 1C for energy cells and up to 3C for power cells.
How many cycles should a sodium-ion battery retain 80 percent capacity?
Commercial sodium-ion cells commonly reach 2,000 to 4,000 cycles at 80 percent retention under room-temperature testing at moderate depth of discharge, though the exact figure depends on chemistry and duty profile.
What standards apply to sodium-ion battery cycling tests?
Common references include IEC 62619 and UL 1973 for stationary cells, UN38.3 for transport, and GB/T 43826 for sodium-ion cells, with the protocol design chosen to satisfy the relevant market.
Further Reading
References