Drone Battery BMS Telemetry and Health Monitoring
When a drone falls out of the sky, the failure almost never starts at the moment of the crash. In my fifteen years building packs at Horizon Power, I have torn down enough returned drone battery units to know the truth: the cell that failed was quietly telling us it was going to fail for dozens of flights beforehand. The only question was whether anyone was listening. That listening system is the Battery Management System, and the discipline of reading what it reports is drone battery BMS telemetry health monitoring. This article walks through exactly how we instrument a pack, what signals matter, how we turn raw samples into state-of-health, and how that data keeps a fleet flying instead of grounding it.
Why BMS Telemetry Is the New First Line of Defense
A decade ago, most operators treated a lithium pack as a black box: charge it, fly until the voltage dropped, swap it, repeat. That worked poorly and it killed packs early. Today a drone lithium battery is a sensor network first and an energy store second. A modern BMS samples every cell several times per second, computes pack current and temperature, and streams a heartbeat to the ground station. The difference between a safe fleet and a grounded one is usually whether the operator has wired that telemetry into a habit of reading it.
At Horizon Power we design the BMS and the monitoring story together, because the cell chemistry is only as good as the data you extract from it. A high-energy NMC cell and a long-life LFP cell behave very differently under load, and the telemetry is what lets us prove a pack is healthy rather than hope it is.
The Signals a Drone Battery BMS Actually Samples
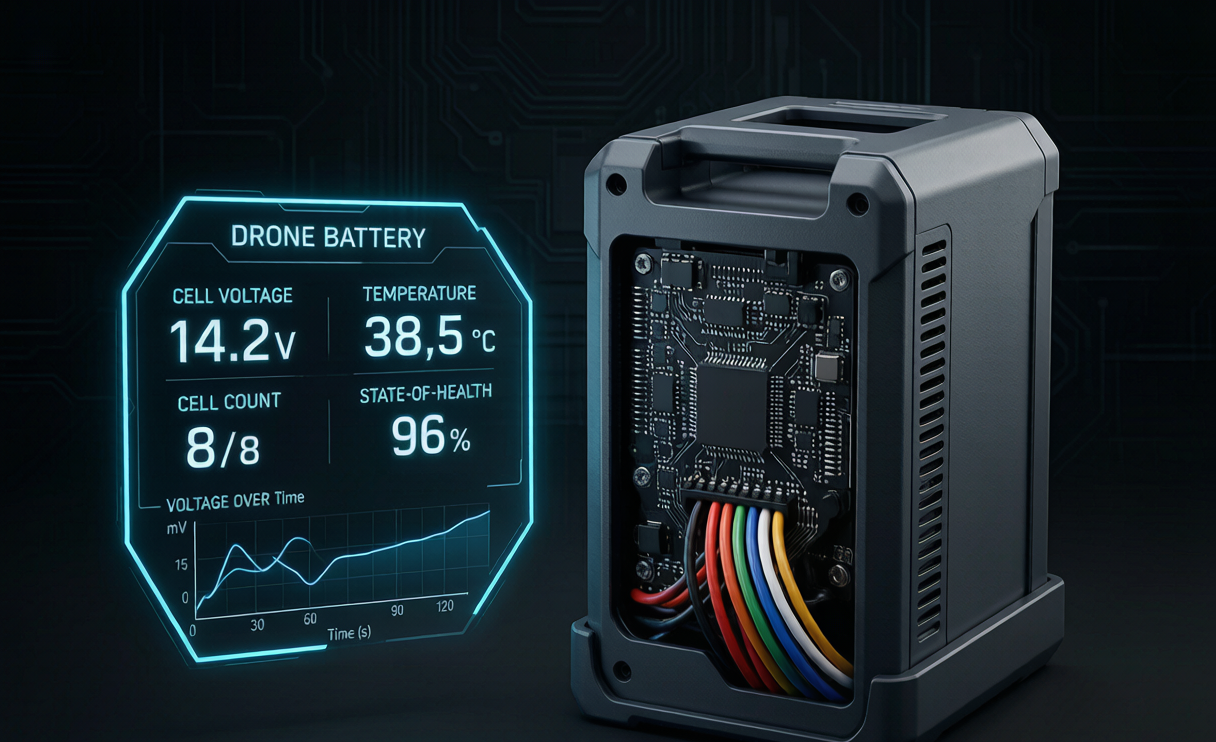
People imagine telemetry as a single “battery percentage.” In reality a useful drone lithium battery monitor is a stack of independent measurements, each with its own accuracy budget.
- Per-cell voltage. Measured to ±2–5 mV across a 6S–14S string. This is the highest-value signal: a single cell drifting 30 mV below its neighbors is the earliest reliable warning of an internal-short or imbalance.
- Pack current. Sampled with a shunt or Hall-effect sensor at ±0.5–1% full scale. Current is what lets us do coulomb counting and detect a sudden spike that precedes a fault.
- Temperature. NTC thermistors on at least two cells plus the BMS board itself, accurate to ±1 °C. We watch both the hottest cell and the gradient across the pack.
- MOSFET and balancer state. Charge/discharge FET on/off, balancing active, and the FET case temperature.
- Cycle and energy counters. Ampere-hours in and out, watt-hours delivered, and the count of full-equivalent cycles since birth.
Typical sampling is 1–10 Hz for steady flight, with event triggers capturing up to 100 Hz for a hard landing, a current spike, or a sharp voltage sag. The key engineering choice is not the top rate but the consistency of logging, because trend detection needs a continuous record.
Estimating State of Charge, State of Health, and State of Energy
Three numbers get confused constantly, so let me separate them clearly.
- State of Charge (SOC) is “how full right now.” We fuse coulomb counting with a Kalman filter against the open-circuit voltage curve, holding accuracy to roughly ±3–5% even after a hard maneuver.
- State of Energy (SOE) is “how many watt-hours I can still use at this load and temperature.” It is SOC corrected for the fact that a cold pack cannot deliver its warm capacity.
- State of Health (SOH) is the long-term one that matters for safety. We estimate SOH from two independent signals: measured capacity against the newborn baseline (a 0.25–0.5C discharge reference test), and internal impedance growth measured by electrochemical impedance spectroscopy around 1 kHz.
A lithium battery that has lost 20% of its birth capacity is, by our rule, at end of service — not because it cannot fly, but because its margin has collapsed and its impedance has climbed enough to run hot. We flag a pack for retirement at 80% SOH, at 2× its baseline internal resistance, or whenever any cell delta exceeds 50 mV under load. These thresholds are what turn telemetry from a dashboard into a go/no-go decision.
Wireless Telemetry and the Ground-Station Link
A monitor you cannot see on the ground is worthless mid-mission. We push BMS telemetry over the existing 2.4 GHz control link or a dedicated 900 MHz side-channel at 50–250 kbps, with a heartbeat every 1–5 seconds. The payload is compact: cell-min, cell-max, pack current, two temperatures, SOH, and a fault byte. Over MAVLink or a lightweight proprietary frame, that is a few hundred bytes per update — negligible against the video stream.
The engineering point operators miss is latency planning. A 5-second heartbeat means the pilot sees a thermal excursion up to 5 seconds late. For high-C racing or heavy-lift work we drop the heartbeat to 1 second and add an on-board audible/LED alarm so the pack can scream before the ground station even receives the packet. Telemetry is a partnership between the BMS and the human, and the human must never be the only alarm.
Fleet Health Dashboards and Predictive Maintenance
One drone is a hobby; fifty drones is a data problem. For fleet operators we aggregate per-pack telemetry into a dashboard that ranks every drone battery by SOH and by risk score. The score blends impedance growth rate, the steepest recent cell-delta event, and the number of hard landings logged. A pack climbing the risk list gets pulled for a reference capacity test before it ever grounds an aircraft.
This is where drone battery BMS telemetry health monitoring pays for itself. A customer running 60 inspection drones cut unexpected in-flight shutdowns by replacing packs on a predicted schedule instead of a reactive one. We did not change the cells — we simply let the data tell us which packs were tired. Predictive maintenance turns a fixed consumable into a managed asset with a known retirement date.
Anomaly Detection: What Good Engineers Watch First
If you only glance at one number, glance at cell-voltage delta. In a healthy 6S pack the spread at rest is under 10 mV; under load it may reach 20–30 mV; anything past 50 mV under load is a flag. The second signal is impedance trend, not the instantaneous value. A cell whose resistance grows 10–20% in a month is degrading even if its capacity still reads fine. The third is temperature gradient: when one cell runs 5–8 °C hotter than its neighbors in identical conditions, something inside that cell has changed.
We train operators to treat a single flagged flight as a note and two flagged flights as an inspection. The cost of pulling one pack for a 20-minute reference test is trivial next to the cost of a fire, a lost airframe, or a downed inspection contract. Telemetry only protects you if the warning changes behavior.
Compliance Logging for FAA and EASA Operations
Commercial operators under FAA Part 107 or EASA rules are increasingly asked to prove airworthiness, and BMS logs are now part of that story. We record, for every pack, the birth capacity, each reference-test result, the peak temperature seen, and the retirement decision with its triggering threshold. That audit trail maps cleanly onto transport and safety standards: UN38.3 (T.1–T.8) for the cell and pack, IEC 62133-2:2017 for secondary-cell safety, and the FAA/EASA 100–160 Wh carry-on limit for packs moved by crew.
For a custom battery solution built to a specific airframe, the log also documents that the pack was flown within its qualified envelope — not pushed past the current or temperature it was validated against. That distinction matters the day an insurer or regulator asks why a pack failed, and the telemetry answers before the engineer has to guess.
Designing a Custom battery solution Around Telemetry
The best monitoring is designed in, not bolted on. When we spec a custom battery solution for a survey drone, we decide the sensor points, the sample rate, and the retirement thresholds before we choose the wrap. A long-endurance mapping drone wants a slower heartbeat and a focus on SOH trend; a heavy-lift unit wants fast current sampling and aggressive temperature alarms. The same lithium battery chemistry serves both, but the telemetry philosophy is different.
My standing advice to any operator building a program: pick your retirement thresholds on day one, log everything the BMS can see, and review the fleet dashboard weekly. The packs that surprise you are almost always the ones whose data you stopped reading.
How accurate is drone battery BMS voltage telemetry?
A well-designed BMS reads each cell to ±2–5 mV, which is tight enough to catch a single weak cell 30–50 mV below its neighbors long before it becomes unsafe. Current is sampled to ±0.5–1% and temperature to ±1 °C at the sensor. The accuracy that matters for safety is the per-cell delta, not the absolute number.
What SOC, SOH, and SOE actually mean for a drone battery?
SOC is the instantaneous fill level, held to about ±3–5% by fusing coulomb counting with the voltage curve. SOH is long-term health, estimated from capacity loss and impedance growth; we retire at 80% SOH. SOE is usable energy at the current load and temperature — important because a cold pack delivers far less than its warm rating.
How cold weather affects drone lithium battery telemetry and range?
Capacity fades with temperature: roughly 100% at 25 °C, 85% at 0 °C, 70% at −10 °C, and 55–60% at −20 °C. Good telemetry reports SOH corrected for temperature so the pilot sees true usable energy, and a heated pack or pre-warm cycle keeps the core in a 10–25 °C window where the cells deliver rated performance.
What BMS signals should trigger retirement of a drone battery?
We retire a pack at 80% of birth capacity (SOH), at 2× its baseline internal resistance, or whenever any cell shows more than 50 mV delta under load. Two flagged flights in a row, or a 10–20% month-over-month impedance climb, also send a pack to inspection before it grounds an aircraft.
Can BMS telemetry help with FAA and EASA compliance?
Yes. Per-pack logs of birth capacity, reference-test results, peak temperature, and retirement decisions form an airworthiness audit trail that supports UN38.3, IEC 62133-2:2017, and the FAA/EASA 100–160 Wh transport limits. For custom packs the log also proves the unit flew inside its qualified envelope.