Semi-Solid State Battery Impedance Spectroscopy Diagnosis
At Horizon Power I have spent the last several years moving semi-solid state battery cells from prototype benches into real production lines. One instrument has earned a permanent place on my workbench: the electrochemical impedance spectrometer. In this article I explain how I use semi-solid state battery impedance spectroscopy for diagnosis, what the curves actually tell me, and where the method stops being useful. If you are qualifying cells, screening production lots, or investigating a warranty return, this is the diagnostic workflow I recommend to engineering teams.
What Impedance Spectroscopy Measures in Semi-Solid Cells
Impedance spectroscopy, usually called EIS, applies a small alternating current across the cell at many frequencies and records how the cell resists that signal. For a semi-solid state battery the answer is a spectrum, not a single number. The high-frequency intercept on the real axis gives the ohmic resistance: electrolyte, current collectors, and weld joints. The semicircles in the mid-frequency range map to charge-transfer reactions and interface layers. The low-frequency tail reflects lithium-ion diffusion inside the electrodes.
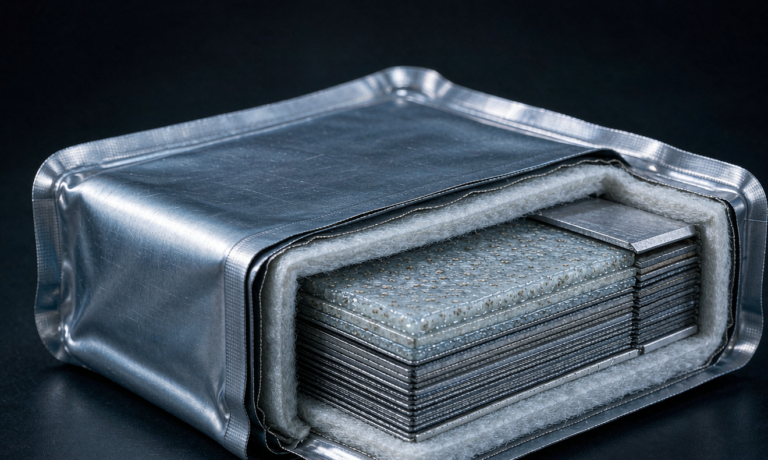
The reason I trust EIS on semi-solid cells is that the viscous composite separator sits between a liquid and a true solid electrolyte, so its resistance shifts in ways a simple DC measurement misses. A healthy cell gives me a clean, stable spectrum. A cell with a growing hidden defect gives me a moving target I can catch weeks before capacity fade shows up in a discharge curve.
Test Setup and Equipment I Use
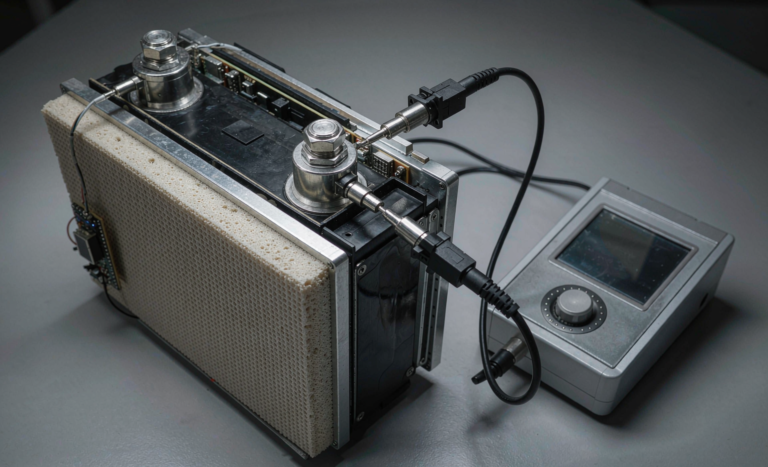
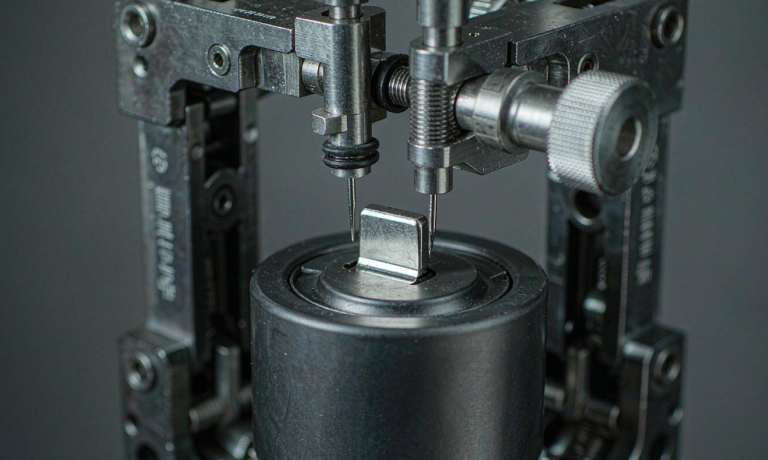
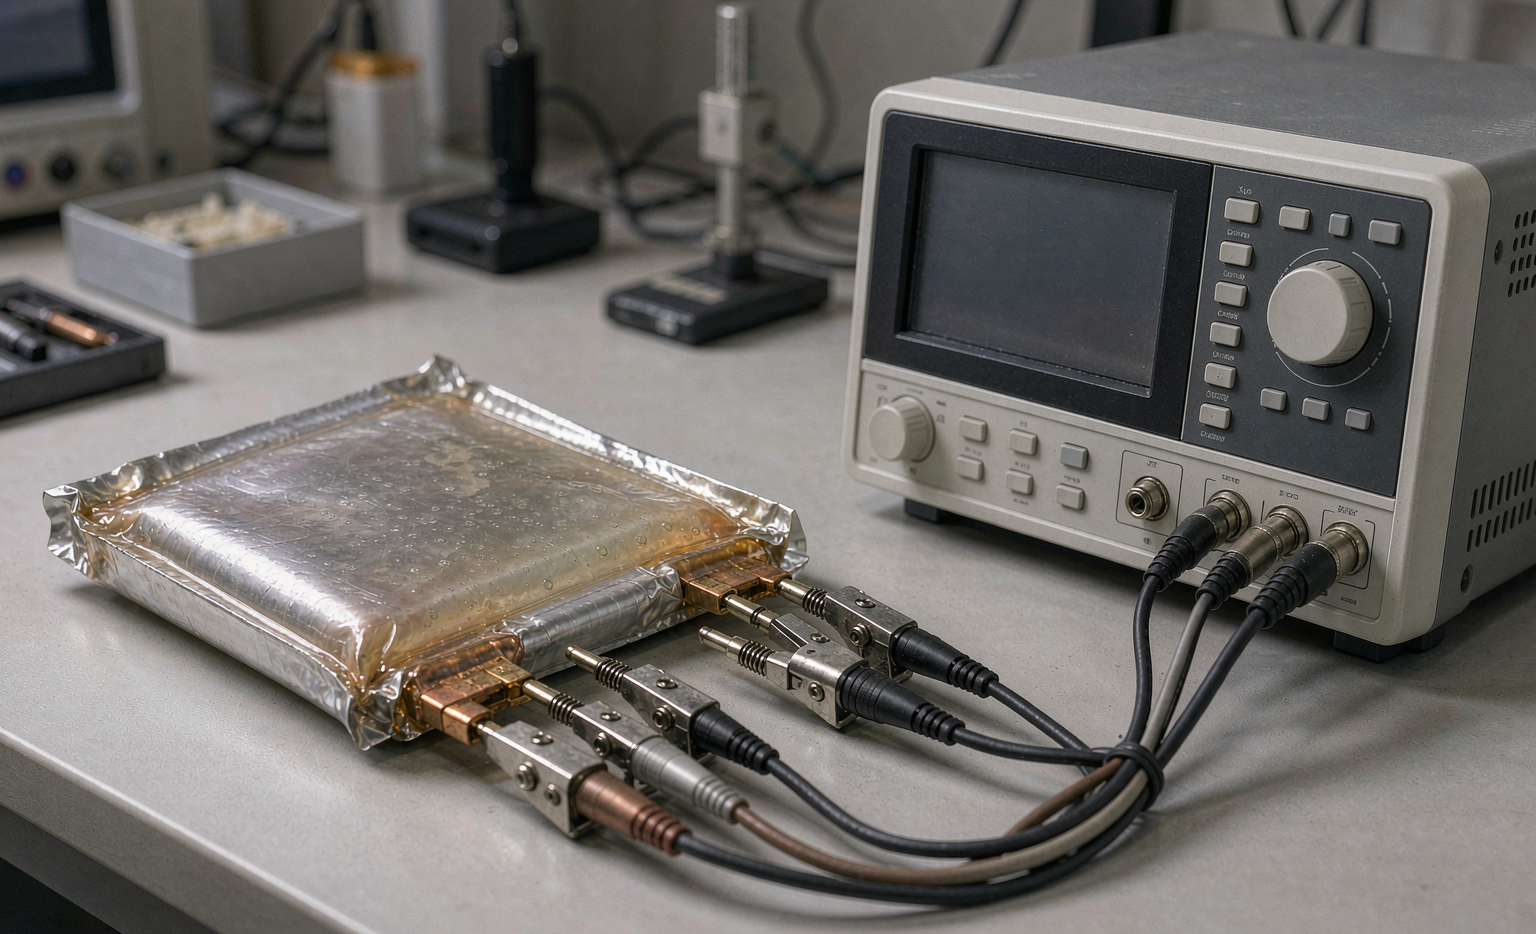
I run cells inside a temperature chamber held at 25 degrees Celsius unless I am deliberately studying temperature behavior. The potentiostat must sink microamps cleanly, and I keep the amplifier noise floor below 1 microvolt so the high-frequency arc is not buried in garbage. I always use a four-wire Kelvin connection to remove lead and contact resistance from the reading.
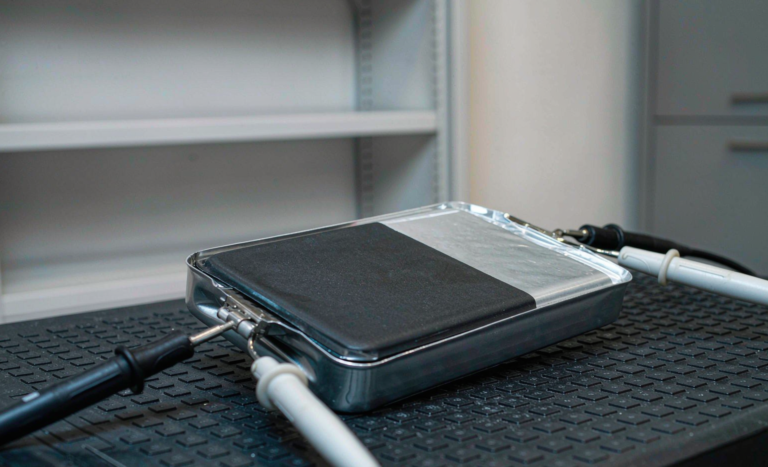
For pouch and prismatic semi-solid cells I clamp the tabs with gold-plated fixtures rather than alligator clips, because a loose clip adds a contact semicircle that masquerades as a real interface. I set the AC perturbation to 10 millivolts RMS, small enough to stay inside the linear response region of the electrode. This matches the small-signal assumption behind the equivalent-circuit models most labs use.
Reading the Nyquist Plot
The Nyquist plot puts the imaginary part on the vertical axis and the real part on the horizontal axis. A healthy semi-solid state battery shows a small ohmic intercept and one or two well-separated semicircles. When the first semicircle grows after cycling, I read it as solid electrolyte interphase growth on the anode. A depressed semicircle, flattened rather than circular, tells me the process is distributed, which is normal for composite semi-solid electrodes because the active particles sit in a viscous matrix.
The low-frequency tail should rise at roughly 45 degrees in a fresh cell. If that tail bends toward vertical too early, ion diffusion is being throttled, often by dry regions in the composite. I treat a sudden change in tail slope as a flag to open the cell, because it is cheaper to find the dry spot than to ship a field failure.
Detecting Lithium Plating and Interface Growth
Lithium plating is the failure mode I watch most closely in winter field returns from cold regions. After a cold charge, if the low-frequency arc suddenly shrinks while the mid-frequency arc grows, that is the signature of metallic lithium forming on the anode surface. EIS catches this earlier than capacity fade, sometimes a full month before the customer notices shorter runtime.
The interface resistance of a semi-solid cell typically climbs 15 to 30 percent over the first 100 cycles as the interface stabilizes, then flattens. A cell whose interface resistance keeps climbing past 300 cycles is a warranty candidate in my book. I log the intercept and the first arc on every returned unit so I can compare against the as-shipped golden spectrum.
Using EIS for Production Lot Screening
On the production floor I do not need a full spectrum for every cell. I record a reference spectrum from a golden cell, then measure a two-point ohmic value and a single mid-frequency arc on each lot sample. If the lot median arc exceeds the golden cell by more than 10 percent, I hold the lot and recheck the electrode coating and stacking pressure.
This approach caught a bad batch of separator lamination last year before it reached a drone customer, and it has become part of our incoming inspection plan for every custom battery solution we ship. The whole screen takes under two minutes per sample, so the cost is trivial next to a recall. I pair it with a visual weld check because EIS alone will not reveal a cold solder joint that happens to read low resistance at one frequency.
Limits and Where I Pair EIS with Other Tests
EIS is fast and non-destructive, but it is not a complete answer. It cannot tell me absolute capacity, only resistance-derived hints about what is happening inside. I pair it with a capacity check at C/3, a voltage self-discharge test over 24 hours, and a tear-down when a cell fails the other screens.
I also avoid EIS below freezing because the semi-solid electrolyte stiffens and the spectrum loses physical meaning. For transport safety screening I rely on UN38.3 pulse, overcharge, and crush tests rather than EIS, and for cell-level safety qualification I cross-check against IEC 62133. Impedance is a diagnostic, not a certification, and I keep those two jobs clearly separated in our test reports.
Equivalent Circuit Models I Fit to the Data
Raw Nyquist points are useful, but they become repeatable only when I fit them to an equivalent-circuit model. For most semi-solid cells I use a series combination of an ohmic resistor, one or two constant-phase elements for the interface and charge transfer, and a Warburg element for diffusion. The constant-phase element replaces a perfect capacitor because real composite electrodes are never ideal, and forcing a pure capacitor hides the very distribution I want to see.
I keep the model honest by limiting it to the arcs the data actually show. Adding a third semicircle the spectrum does not support just absorbs noise and produces numbers that drift between labs. When I report a result to a customer or a certification body, I attach the fitted curve next to the raw points so anyone can judge the fit quality. That transparency has settled more than one argument about whether a lot was truly out of spec.
Frequently Asked Questions
What frequency range do you scan for semi-solid cells?
I usually sweep from 100 kilohertz down to 10 millihertz. The high end captures ohmic and contact resistance, the mid range captures charge transfer and interface layers, and the low end captures diffusion. For a quick production screen I compress the sweep to 100 kilohertz to 1 hertz, which is enough to read the ohmic intercept and the first arc.
Can impedance spectroscopy replace a capacity test?
No. EIS infers health from resistance, but it does not measure how many milliamp hours the cell actually delivers. I use EIS to find problems early and to sort lots, then confirm with a real capacity test at C/3 before I release a batch or accept a warranty claim.
How often should production lots be screened?
I screen every production lot at incoming inspection using the two-point ohmic and single-arc method described above. Full spectra are reserved for engineering validation, incoming golden-cell baselines, and returned-field units. Daily screening of lots is cheap and has saved us from several near-misses.
Does temperature change the Nyquist plot?
Yes, strongly. Higher temperature lowers the electrolyte and interface resistance, shrinking the arcs, while low temperature stiffens the semi-solid matrix and inflates them. That is why I standardize at 25 degrees Celsius and only move the chamber when I am studying thermal behavior on purpose.
Is EIS useful for field returns and warranty cases?
Very useful. I compare the returned cell spectrum against its as-shipped golden baseline to separate genuine manufacturing drift from customer misuse. A cell that shows plating or abnormal interface growth tells me exactly which failure mode to report, which makes warranty decisions faster and far more defensible.
Further Reading
References