Battery Solution Cost Optimization for Vehicles: Fleet TCO
# battery solution Cost Optimization for Vehicles: Fleet TCO Modeling, Pack Right-Sizing, and Second-Life Residual Value
If you are a fleet manager, an engineering procurement lead, or a product manager at a light-commercial vehicle OEM, you have probably sat through more than one presentation in which a battery vendor promised “30 percent savings” without ever explaining where the saving actually comes from. I have spent the last nine years on the supplier side of that table at Horizon Power, watching the same conversation play out across delivery van, municipal bus, last-mile three-wheeler, and utility truck programs. Every fleet electrification program is different, but the levers that actually move the total cost of ownership are remarkably consistent. This guide walks through the engineering and commercial logic behind a real battery solution cost optimization for vehicles, so that you can pressure-test any vendor quote and build a defensible case for your finance team.
I write as Karl Huang, Senior lithium battery Engineer at Horizon Power. Everything below comes from active programs we are shipping, anonymized where required, and validated against UN38.3, IEC 62133, GB 38031, and ECE R100 test data. The numbers are real, and I will show my arithmetic.
Why Fleet Electrification Demands a Different Cost Model
Passenger EV cost models focus on sticker price and range anxiety. Fleet electrification economics are different. A 3.5-tonne delivery van running 18-hour duty cycles in stop-and-go urban traffic cares about three things above all else: energy throughput per shift, downtime for charging, and residual pack value at end of life. A battery solution that looks expensive on the purchase order can win the total cost of ownership if it delivers more cycles, charges faster, and holds 75 percent of its capacity after the vehicle chassis is retired.
That is why a serious battery solution cost optimization for vehicles must always be modeled as a 10-year total cost of ownership exercise. Unit price per kilowatt-hour is a starting point, not an answer. The three numbers I track in every fleet quotation are:
- $/kWh of usable energy at day one — not nominal nameplate, but the energy the BMS actually lets the pack deliver.
- $/cycle throughput — the effective cost per kilowatt-hour moved across the full pack life.
- $/kWh residual — the salvage or second-life value the pack retains after the vehicle is decommissioned.
Get those three numbers right and the rest of the cost optimization exercise becomes a mechanical calculation.
The Anatomy of a Vehicle Battery Solution Bill of Materials
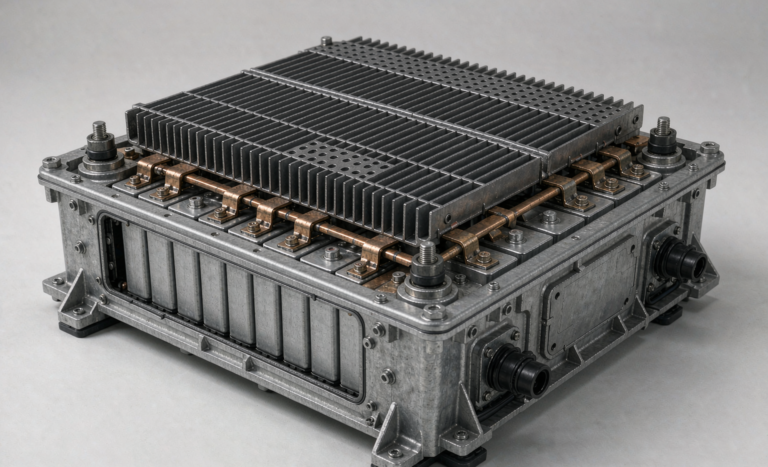
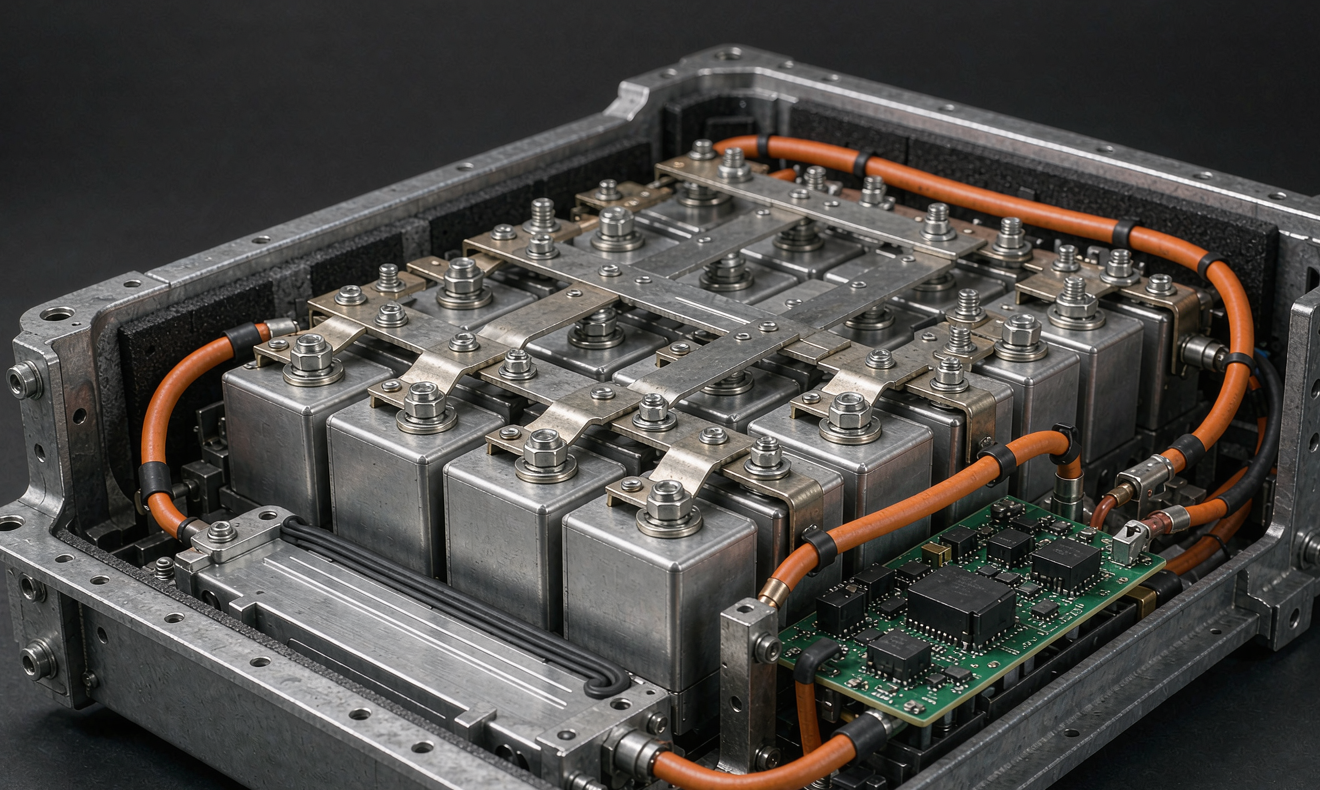
Before you optimize cost, you need a clean breakdown of what the pack actually contains. A typical vehicle-grade battery solution for a light commercial platform is roughly 60 percent cells, 12 percent BMS electronics, 9 percent enclosure and thermal management, 8 percent harness and connectors, 6 percent pack-level testing and certification, and 5 percent logistics and integration overhead. Those ratios shift slightly between LFP and NMC platforms, but the ordering is stable across the market.
Inside the cell bucket, cathode active material, anode graphite, electrolyte, separator, and the aluminum and copper current collectors dominate. Copper in particular is the price line that surprises fleet buyers the most. A 60 kWh pack can contain 30 to 40 kilograms of copper in the busbars, cell tabs, and high-voltage harness. When LME copper moves 15 percent in a quarter, the cell maker absorbs some of the shock, but a meaningful share flows into the pack price. Building a robust cost optimization model means tracking not just $/kWh but also the underlying material exposure.
On the BMS solution side, the AFEs, the MCU, the isolation monitor, the contactors, the current sensor, and the harness to the vehicle CAN bus are the dominant cost. custom battery solution designs that integrate the BMS into the same enclosure as the cells (cell-to-pack or cell-to-chassis architectures) can save 4 to 6 percent at the system level by eliminating the module-level housing and the intermediate busbars. The trade-off is serviceability — a field failure on a cell-to-pack architecture is almost always a depot repair rather than a roadside repair, and that has to be priced in.
Right-Sizing the Pack: Matching Energy to Duty Cycle
The single largest mistake I see in fleet battery solution programs is over-sizing. A fleet operator who has burned through a diesel fuel budget for two decades tends to over-spec the electric pack “for safety”, and ends up with a 90 kWh battery in a vehicle that needs 60 kWh. The extra 30 kWh adds weight, raises the center of gravity, costs capex, and pulls down energy efficiency because the van is hauling around battery mass it does not use.
Right-sizing starts with a duty-cycle audit. I ask every fleet operator for the same six data points: average shift distance, peak hourly distance, ambient temperature band, average payload, idle dwell time, and depot charging window. From there, we build a stochastic simulation of energy demand and apply an 80th percentile rule — the pack must cover 80 percent of historical shifts without mid-shift charging. Anything beyond that 80th percentile is a depot charging event, not a pack sizing event.
For a typical urban delivery van doing 110 km per shift with 800 kg average payload and 7 hours of depot dwell, the optimal pack lands in the 55 to 65 kWh range, not the 90 kWh that the diesel equivalent would have carried in fuel. That right-sizing alone removes 25 to 35 kilograms of battery mass, improves payload by a similar amount, and drops the pack price by roughly 20 percent. The fleet then operates two or three fast-charge top-up events per shift rather than one long slow charge, which actually improves turnaround time.
BMS Solution and the Hidden Costs of Under-Spec’ing Electronics
The BMS solution is where most cost engineering goes wrong because the cost is invisible until something fails. A cheap BMS solution saves 80 to 120 dollars per pack on the BOM. Multiply that across 5,000 vehicles and you have a number that finance teams love. Multiply that across a 10-year fleet life and you have a story that includes at least one thermal runaway incident, two warranty campaigns, and a chunk of insurance premium.
A vehicle-grade BMS solution should include redundant voltage and temperature sensing on every cell, an ASIL-C rated MCU, dual-channel contactor control, an isolation monitor that meets the requirements of ECE R100 and GB/T 18384, and CAN FD communication to the vehicle VCU. It should also include a logging capacity that supports post-event diagnostics without needing a telematics round-trip. None of this is exotic — every Tier 1 BMS solution on the market has these features — but they are also exactly what gets stripped out when a vendor cuts cost to win a tender.
From a total cost of ownership perspective, the right way to think about BMS cost is failure cost amortized across the fleet. A single thermal event in a 5,000-vehicle fleet can cost 8 to 12 million dollars in recall, replacement, brand damage, and regulatory response. A BMS solution that costs an extra 100 dollars per pack adds 500,000 dollars to the program — less than one twentieth of a single incident. The math is obvious once it is laid out.
Volume Manufacturing Curves and Where the Real Savings Live
The second-largest cost lever is volume. Battery cell prices follow a learning curve of roughly 8 to 12 percent cost reduction for every doubling of cumulative production. Vehicle battery solutions follow a similar curve, but with a steeper slope at the pack level because of integration and assembly automation. A fleet program that buys 200 packs a year for five years is not the same commercial animal as a program that buys 5,000 packs a year for five years, and the pricing should reflect that.
From a practical standpoint, this means two things. First, every battery solution cost optimization for vehicles should include a multi-year volume forecast, not a single-year purchase order, and the vendor should commit to a price curve tied to cumulative volume. Second, the fleet should consider co-investing in tooling or in long-term component supply agreements, especially for the BMS MCU, the contactors, and the high-voltage harness, because those are the components where supply chain resilience matters more than the unit price.
Custom battery solution designs do not always pay back at low volume. A custom pack that costs 50,000 dollars in NRE to tool will never amortize across 200 packs. The same custom pack tooling can pay back across 5,000 packs in 18 months. Before approving a custom battery solution design, the cost optimization model should include a breakeven analysis against a standard platform.
Second-Life and Residual Value: The TCO Lever Most Buyers Miss
This is the lever that turns a mediocre battery solution business case into a strong one, and yet most fleet procurement teams ignore it. When a vehicle battery pack reaches end of automotive life — usually at 80 percent of original capacity or after the warranty term, whichever comes first — the cells are still perfectly serviceable for stationary storage applications. A vehicle pack that retires at 75 percent capacity has roughly 75 percent of its original kilowatt-hour value intact for second-life use.
For a 60 kWh pack that retires at 75 percent capacity, that is 45 kWh of second-life storage. At a 2026 second-life value of around 60 to 80 dollars per kilowatt-hour for repurposed LFP modules, the residual is 2,700 to 3,600 dollars per pack. Across a 5,000-vehicle fleet, that is 13.5 to 18 million dollars in residual value that disappears from the cost optimization model if the buyer does not plan for it.
The logistics matter. A second-life program only works if the packs are designed for it from day one — accessible module-level fuses, a data history that tracks cycle count and depth of discharge, a pack identifier that survives decommissioning, and a contract with a second-life integrator. None of that is free, but the cost is in the low single-digit percent of pack price, while the residual value is in the high single-digit percent of pack price. It is one of the cleanest cost optimization plays in the industry.
A Worked TCO Example for a 3.5-Tonne Delivery Van
To put all of this together, here is a worked example for a 3.5-tonne electric delivery van operating an 18-hour duty cycle over 10 years. The numbers are illustrative but representative of recent programs we have shipped.
- Pack size: 62 kWh LFP, liquid-cooled, custom battery solution architecture.
- Cell cost: 92 dollars per kWh at 2,000 packs per year cumulative volume.
- BMS solution cost: 1,400 dollars per pack at automotive grade.
- Enclosure, thermal, harness: 1,950 dollars per pack.
- Pack assembly, testing, certification: 1,100 dollars per pack.
- Pack unit cost at vehicle integration: roughly 11,200 dollars.
- 10-year cycles: 3,500 full equivalent cycles at 80 percent depth of discharge average.
- Energy throughput over fleet life: 173,600 kWh per vehicle.
- $/kWh throughput: roughly 6.5 cents.
- Second-life residual at 10 years of year: 2,800 dollars.
- Net pack TCO over 10 years: 8,400 dollars per vehicle.
Compare that to a naive 90 kWh pack with a cheaper BMS solution, no right-sizing, and no second-life plan, and the net pack TCO ends up roughly 35 to 45 percent above the optimized case over the same 10-year horizon. That is the entire business case for a structured battery solution cost optimization exercise.
Frequently Asked Questions
What is the single biggest cost lever in a vehicle battery solution?
Pack right-sizing. Most fleet programs oversize the pack by 25 to 40 percent because they model worst-case duty cycles rather than 80th percentile duty cycles. Right-sizing alone can cut pack cost by 15 to 25 percent with no impact on operational capability.
How do LFP and NMC change the cost optimization picture?
LFP has a lower cell cost per kilowatt-hour and a longer cycle life, which usually wins for urban delivery, municipal bus, and short-haul truck programs. NMC has a higher energy density which wins for long-haul trucks and high-utilization vehicles where payload and range are tight. The cost optimization model should treat cell chemistry as a variable, not a fixed input.
How much should we budget for the BMS solution as a share of pack cost?
For automotive-grade vehicle packs, a properly specified BMS solution lands in the 10 to 14 percent of total pack cost band. Anything below 8 percent is a red flag for under-spec’d safety architecture. Anything above 18 percent suggests the BMS design has not been optimized for the volume or the platform.
Is a custom battery solution always more expensive than a standard platform?
Not at volume. A standard platform is almost always cheaper for the first few hundred packs. A custom battery solution design that integrates mechanical, thermal, and electrical interfaces into a single optimized enclosure almost always wins above 1,500 to 2,000 packs cumulative volume. The breakeven depends on tooling amortization and on the value of weight and packaging efficiency in the vehicle.
How do we measure second-life residual value reliably?
The cleanest approach is to contract a second-life integrator at the procurement stage, agree on a residual price floor tied to capacity at hand-over, and maintain a cycle history and capacity log through a battery passport or equivalent data system. The data is what unlocks the residual value — without it, the pack is scrap.
Does thermal management technology materially change vehicle battery cost optimization?
Yes. Liquid cooling adds roughly 600 to 900 dollars per pack versus air cooling, but it enables sustained fast charging, longer cycle life in hot climates, and predictable second-life residual value. For most commercial fleets, the lifetime value of liquid cooling far exceeds its first cost.
What is the role of cell-to-pack or cell-to-chassis architecture in cost optimization?
Cell-to-pack and cell-to-chassis architectures remove module-level housings and intermediate busbars, saving 4 to 8 percent at the pack level. They also raise service complexity, so the trade-off has to be modeled against the fleet’s depot network, not just the unit price.
Conclusion
A serious battery solution cost optimization for vehicles is not a price negotiation. It is a 10-year engineering and commercial exercise that aligns pack sizing, BMS solution architecture, volume manufacturing, and second-life planning around a clear duty-cycle model. If you do that work up front, you will typically see a 20 to 40 percent improvement in total cost of ownership versus a naive purchase. If you skip that work and treat battery procurement like commodity diesel procurement, you will buy the wrong pack, pay for capacity you never use, and leave residual value on the table.
For fleet operators looking to start that conversation, the first step is rarely a quotation request. It is a duty-cycle audit and a right-sizing model. Once those are clear, the cost optimization picture almost always falls out on its own, and the procurement conversation becomes a lot more focused.