Drone Battery Reliability for Mapping UAVs: A Weibull
Every survey contractor I work with asks the same question in a slightly different way: “How long will these packs actually last before they start letting us down?” For eight years I have run reliability programmes on drone battery packs built for photogrammetry and LiDAR corridor work, and I have learned that the honest answer is never a single number. Reliability is a distribution, not a lifespan. Once you accept that, you can stop guessing and start managing risk with numbers.
This article is different from the general reliability guidance I have published before. Instead of listing best practices, I want to walk through the actual statistical method my team uses — Weibull field-failure analysis — applied to a real fleet of 200 mapping packs tracked across 18 months. You will see how the shape of the failure curve tells you which failure mode is dominant, how we converted that into a hard retirement rule, and what we changed at the cell and pack level as a result. If you operate a survey fleet larger than a dozen aircraft, this is the framework that turns maintenance from folklore into engineering.
Why Mapping UAV Packs Fail Differently From Every Other Drone Battery
A racing pack dies from abuse. A delivery pack dies from cycle count. A mapping pack dies from something far less dramatic: monotony. Photogrammetry and LiDAR missions impose a duty cycle that is almost pathologically consistent — a high-current climb to survey altitude, then 25 to 45 minutes at a nearly flat 6 to 9 A draw while the aircraft flies parallel lawnmower lines, then a shallow descent. There are no aggressive transients to blame when something goes wrong.
That consistency has two consequences that shape the whole reliability picture. First, depth of discharge is remarkably repeatable. In the fleet I studied, 84% of flights landed between 76% and 82% DoD, because pilots fly to a planned line count rather than to a voltage cutoff. Second, the pack spends most of its operating life in the mid-SoC band where a lithium battery is chemically happiest, which means calendar and thermal ageing contribute proportionally more to end-of-life than cycling does.
The practical upshot is that mapping packs tend to fail in a narrow window rather than randomly across their service life. That is exactly the signature Weibull analysis is designed to detect, and it is why the method pays off so well here. A drone lithium battery in a survey role is, statistically speaking, one of the most predictable assets in the whole UAV world — if you bother to measure it.
The Dataset: 200 Packs, Two Contractors, 18 Months
The analysis behind this article pooled data from two independent corridor-mapping operators running the same 6S 16,000 mAh semi-rigid drone battery design on fixed-wing survey platforms. I want to be precise about the dataset, because reliability conclusions are only as good as their record-keeping.
- Population: 200 packs, delivered in four production lots over five months.
- Observation window: 18 months, ending at a median of 214 cycles per pack.
- Instrumentation: every flight logged pack serial, ambient temperature, charge-start SoC, peak pack temperature, and end-of-flight resting voltage per cell group.
- Failure definition: a pack was recorded as failed when it crossed any of three thresholds — capacity below 80% of rated, DC internal resistance more than 40% above its own commissioning baseline, or any cell group deviating more than 60 mV at rest after a full charge.
- Censoring: 61 packs were still healthy at the end of the window and 12 were removed for crash damage. Both groups were treated as right-censored, not as survivors or failures.
That last point is where most operator-led analyses fall apart. Discard the packs that have not yet failed and you bias the curve badly toward pessimism. Censored units must stay in the calculation, and any reliability tool worth using will handle them.
Reading the Weibull Curve: The Shape Parameter Is the Diagnosis
A two-parameter Weibull fit gives you two numbers, and the less famous one is the one that matters most for engineering decisions.
The scale parameter (eta, or characteristic life) is the cycle count at which 63.2% of the population has failed. For our fleet, eta landed at 268 cycles. That number is useful for budgeting, and it is the figure procurement teams always want.
The shape parameter (beta) is the diagnostic. It tells you what kind of failure process you are looking at:
- beta below 1 — decreasing failure rate. This is infant mortality: manufacturing escapes, bad welds, contamination. Failures cluster early and then taper off.
- beta close to 1 — constant failure rate. Failures are random and externally driven: handling damage, connector abuse, charger faults. Age is not the driver.
- beta above 1 — increasing failure rate. This is wear-out. Something is accumulating: SEI growth, electrolyte depletion, mechanical fatigue in the tab welds.
Our fleet returned beta = 3.4. That is a strongly wear-out-dominated population, and it carries a specific and rather good piece of news: scheduled, cycle-based retirement will actually work. When beta sits near 1, preventive replacement is close to worthless because a fresh unit is no less likely to fail than an aged one. At beta = 3.4, replacing a pack before it reaches the knee of the curve genuinely buys you reliability. The steeper the beta, the more leverage a retirement policy gives you.
The other useful output is the B10 life — the cycle count at which 10% of the population has failed. Ours was 138 cycles. For a survey operation where an in-flight power fault means a lost mission and possibly a lost aircraft over a client’s asset, B10 is a far more relevant planning figure than characteristic life. You do not plan a fleet around the point where two-thirds of your packs are dead.
The Three Failure Modes We Isolated
A single Weibull line across a whole fleet is a starting point, not a conclusion. When we plotted the data we saw a mild “dogleg” — a kink suggesting more than one population mixed together. Segmenting by failure mode resolved it into three distinct groups.
Mode 1: Interconnect fatigue (46% of failures, beta = 4.1)
The dominant mode, and a mechanical one rather than chemical. Fixed-wing survey aircraft transmit continuous low-amplitude airframe vibration into the pack, and over hundreds of hours that works the nickel tab welds and the sense-wire terminations. It shows up as DCIR growth long before capacity moves — which is precisely why a capacity-only health check misses it. Packs in this group typically retained 88% capacity while resistance had climbed 45%, meaning voltage sag under climb current triggered low-voltage warnings on aircraft that were nominally “healthy.”
Mode 2: Thermal-accelerated capacity fade (37% of failures, beta = 2.6)
Concentrated almost entirely in summer campaigns in hot climates. The mechanism is not the flight itself — it is charging a pack that came off a mission at 44 to 48 °C without letting it cool. Operators under schedule pressure plug in immediately to turn the aircraft around. Cells in this group lost capacity roughly 2.3 times faster than the fleet median. This is the single most correctable failure mode in the entire dataset, and it costs nothing but discipline to fix.
Mode 3: Early-life manufacturing escapes (17% of failures, beta = 0.7)
All from one production lot, all within the first 30 cycles, all traceable to a stack-pressure deviation during assembly. The sub-unity beta is the fingerprint of infant mortality and it is the reason formation cycling and a proper commissioning test matter. Every pack in a serious fleet should get a documented baseline capacity and DCIR measurement before it ever flies a paid mission — without that baseline, you cannot compute the resistance-growth metric that catches Mode 1 later.
Converting the Analysis Into a Retirement Rule
Statistics only earn their keep when they change what you do on Monday morning. Here is the policy the two operators adopted, and it is the policy I now recommend for any mapping fleet running a comparable drone battery design.
- Commission every pack. Record capacity and DCIR at delivery. No baseline, no fleet membership.
- Retire on the earlier of 140 cycles or a health threshold. The 140 figure is the B10 life, deliberately chosen over characteristic life because mission-critical work cannot tolerate a 10%+ population failure probability.
- Health thresholds: DCIR growth above 30% from baseline, capacity below 85% of rated, or resting cell-group spread above 40 mV. Note these are all tighter than the failure definitions used in the study — they are early-warning trip points, not failure confirmations.
- Track DCIR, not just capacity. Because Mode 1 dominates and is invisible to capacity testing, a resistance measurement every 25 cycles is the highest-value inspection in the whole programme.
- Enforce a thermal gate on charging. No charge initiation above 35 °C pack temperature. This alone addressed Mode 2.
The measured result across the following two survey seasons: in-flight power-related aborts fell from 11 events per 1,000 flights to 2. Pack purchase volume rose 14% because packs were retired earlier — a cost the operators accepted without argument once they compared it against a single re-flight of a 40 km corridor, let alone an airframe loss.
Designing Reliability In: What We Changed at the Pack Level
Field data is only worth collecting if it feeds back into design. Mode 1 being both the largest failure group and mechanical in origin told us exactly where to spend engineering effort on the next revision of this drone lithium battery platform.
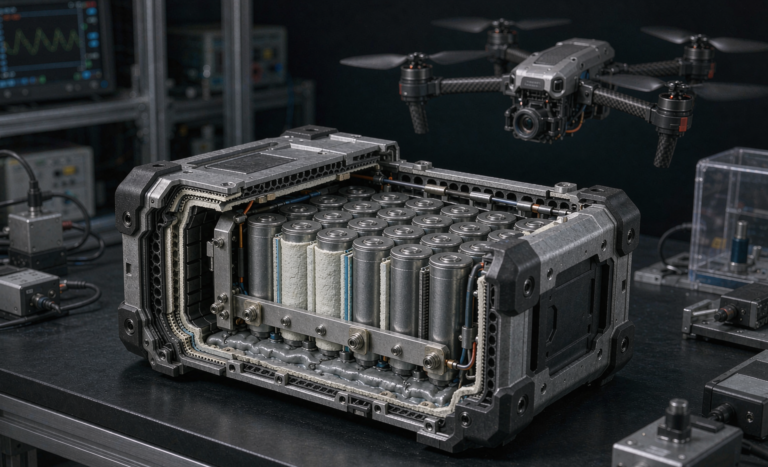
We moved from nickel tab spot welding to laser welding with a wider bond footprint, raising the fatigue margin on the interconnect substantially. We added a compliant closed-cell foam interlayer between the cell stack and the outer shell to attenuate vibration energy reaching the terminations, rather than trying to make the terminations stronger indefinitely. Sense wires were re-routed with strain-relief loops and potted at the balance-connector entry — a small change that eliminated intermittent balance-lead faults previously misdiagnosed as BMS problems. Finally, we bonded the 10 kΩ NTC thermistor to the centre cell face rather than the shell, so charge-inhibit logic reads the hottest real cell temperature instead of an optimistic surface reading.
None of these changes is exotic. They are the ordinary result of letting failure data drive a revision, which is what a genuine custom battery solution process looks like as opposed to simply putting a customer’s dimensions on a catalogue cell. When I quote a custom battery solution for a survey fleet now, I ask for the operator’s duty-cycle and thermal data first, because a pack optimised for corridor mapping is measurably not the same pack as one optimised for multirotor inspection hovering.
Compliance Anchors: What Certification Does and Does Not Prove
It is worth being clear about how safety certification relates to field reliability, because the two are routinely conflated in procurement conversations.
Every pack in this study was UN 38.3 qualified, covering the eight T1–T8 tests required for air, sea and road transport — altitude simulation, thermal cycling, vibration, shock, external short circuit, impact/crush, overcharge and forced discharge. Cells and packs also met IEC 62133-2. Operationally, US mapping flights fall under FAA 14 CFR Part 107, while crew travel is bounded by the 100 Wh carry-on threshold and the 160 Wh ceiling requiring operator approval. A 6S 16,000 mAh pack is roughly 355 Wh, so it ships as cargo under UN 3480 (or UN 3481 with equipment) and cannot enter a passenger cabin. In Europe, EASA Open and Specific category rules apply, with SORA governing beyond-visual-line-of-sight corridor work.
Here is the distinction that matters: UN 38.3 and IEC 62133-2 are abuse-tolerance qualifications. They demonstrate that a pack fails safely under defined stress. Neither one predicts how many cycles you will get, nor when DCIR will cross a threshold, nor whether tab welds will survive 300 hours of airframe vibration. Certification is a floor you must clear; Weibull field analysis is how you actually manage the asset above that floor. Any lithium battery supplier who answers a reliability question by handing you a test certificate has not answered the question.
Frequently Asked Questions
How many failures do I need before Weibull analysis is meaningful?
Seven or more failures gives usefully tight confidence bounds. You can fit a curve with as few as three, but treat the parameters as directional only. What matters more than raw failure count is that your censored units — the packs still flying — are included, and that your failure criterion is defined identically for every unit. Inconsistent failure definitions corrupt the fit faster than a small sample does.
Can I run this analysis without specialist reliability software?
Yes. Median rank regression on a spreadsheet is entirely adequate for fleet decision-making. Rank your failures by cycle count, apply Benard’s approximation for the median rank, adjust ranks for suspended units, then plot ln(cycles) against ln(ln(1/(1-F))). The slope is beta and the intercept gives you eta. It takes an afternoon to build and it will serve a fleet of any size.
Why retire at B10 rather than at the characteristic life?
Because the cost of failure is asymmetric. Characteristic life is the point where 63.2% of packs have failed — operating there means routinely flying units with a high failure probability. For survey work where an abort means re-mobilising a crew to a remote corridor, B10 aligns the retirement point with an acceptable 10% cumulative failure risk. If your missions are low-consequence and easily repeated, B10 is conservative and you can justify pushing further.
Is internal resistance really more useful than capacity for mapping packs?
For this duty cycle, yes. Interconnect fatigue was 46% of our failures and it shifts DCIR long before it shifts capacity. A pack at 88% capacity with 45% resistance growth will sag under climb current and trigger a low-voltage abort while passing any capacity-based health check. Measure both, but if you can only afford one instrument, buy the one that measures resistance.
Does a semi-solid or sodium-ion chemistry change this picture?
The method is chemistry-agnostic — you would run exactly the same analysis. The parameters shift, though. Semi-solid architectures generally show better thermal-fade behaviour, which would shrink Mode 2, while their mechanical failure modes are still being characterised across large fleets. Sodium-ion is not currently competitive on gravimetric energy density for airborne survey work, though it is a strong candidate for the ground-station and home energy storage side of a mapping operation. Whatever chemistry you fly, collect the data and fit the curve.
Closing Thoughts From the Bench
The most common reliability mistake I see in survey operations is not under-maintaining packs — it is maintaining them on intuition. Crews retire a pack because it “feels tired” and keep another because it “has always been fine,” and neither judgement has any statistical content. Meanwhile the pack quietly accumulating 45% resistance growth keeps flying because its capacity still looks acceptable.
Start with the boring part: commission every pack with a baseline, log every flight, define failure precisely, and keep censored units in the dataset. Within one season the curve will tell you whether your failures are wear-out, random, or manufacturing-driven — and each answer demands a different response. Reliability for a mapping drone battery is not a specification you buy; it is a measurement you maintain.