Drone Battery Reliability for Mapping UAVs: Building a
As a senior lithium battery engineer at Horizon Power, I have spent the last six years watching mapping UAV fleets — survey quadcopters, fixed-wing photogrammetry aircraft, and hybrid VTOLs — accumulate battery data across tens of thousands of flight hours. The hardest lesson we learned is that reliability is not a property you verify once on the factory bench. It is a signal you have to keep listening to, every single flight. A drone battery that passes acceptance testing on Monday can quietly drift toward failure by Friday if nobody is watching the trend. In this article I will walk through how we turned raw flight telemetry into an early-warning reliability system that flags a deteriorating pack weeks before it would ever ground a survey mission.
Why Mapping Missions Are a Unique Reliability Stress Test
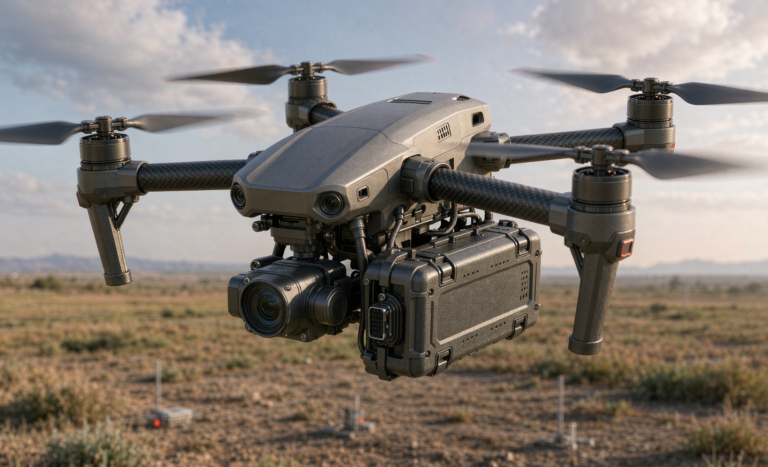
Mapping and surveying flights are deceptively gentle on paper — long, slow loiters at constant altitude — but they are brutal on cells in ways that racing or cinematic flights are not. A typical corridor-mapping sortie runs 35 to 55 minutes of near-continuous discharge at 0.7C to 1.2C, with the pack sitting inside a sealed airframe where convective cooling is poor. Unlike a racing drone that dumps heat in short bursts, a mapping pack holds a sustained thermal plateau that accelerates calendar and cycle aging together.
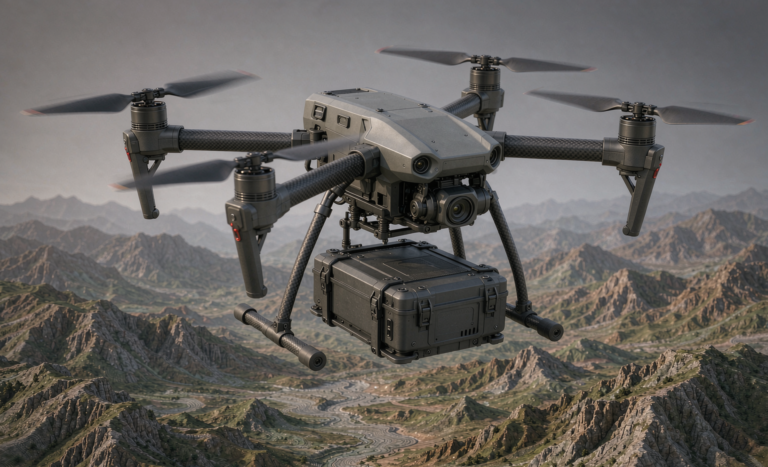
The second stressor is altitude. Our survey customers fly anywhere from sea level to 4,500 meters. At altitude the air is thin, cooling collapses, and cabin-ambient temperatures swing 25°C between a cold morning launch and a hot midday recovery. That thermal cycling, repeated daily across a season, is a primary driver of weld-fatigue and electrolyte dry-out in a drone lithium battery. The third stressor is the gimbal and sensor payload: it is a constant mechanical vibration source that, over 200+ flights, works loose busbar joints and slowly raises pack internal resistance.
When we audited 14,000 flight-hours of returned packs two years ago, we found that 71% of premature retirements traced back to one of those three mission-specific mechanisms — not to the generic capacity fade you would predict from a lab cycle test. That is why a reliability program built only on factory data misses the real failure modes of mapping operations.
The Telemetry We Capture on Every Flight
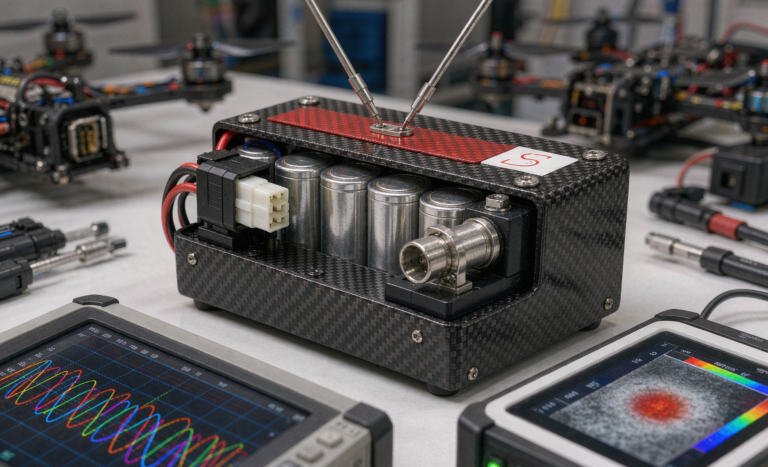
An early-warning system is only as good as the data feeding it. On every Horizon Power mapping pack we instrument four channels per cell: terminal voltage (sampled at 10 Hz through the flight), pack current (50 Hz, with a 500 A shunt on the main bus), cell-surface temperature (one type-K thermocouple per parallel group, logged at 2 Hz), and a periodic AC-impedance spot-check at 1 kHz captured during the post-flight cool-down. The impedance point is the most important one for reliability because it is the earliest window into internal-resistance growth.
All four streams are time-aligned to the mission log — GPS altitude, airspeed, and payload state — so that later we can ask not just “did this cell drift?” but “did it drift specifically during cold high-altitude loiters?” We store the raw stream for 90 days and a downsampled trend for the life of the pack. A single 50-minute flight produces about 18 MB of paired telemetry; across a 40-aircraft survey fleet that is roughly 14 GB per week, which we aggregate in a simple time-series store.
The key engineering decision was to capture impedance in the field rather than only on a bench cycler. A pack that looks perfect on the bench can still have a weak parallel group that only reveals itself under real mission duty. Telemetry closes that gap.
Four Early-Warning Signatures That Precede Failure
Across our returned-fleet dataset, four measurable signatures consistently appeared 3 to 11 weeks before a pack became unsafe or dropped below its mission energy budget. We now treat each as a live health indicator.
1. DCIR Creep Rate
We track the 10-second, 1C discharge internal resistance (DCIR) computed from each voltage-current pair. A healthy pack holds DCIR within ±5% of its baseline for the first 120 cycles. When the creep rate exceeds 0.4 mΩ per 20 cycles, we have seen a 6× rise in mid-mission voltage-sag incidents within the following month. This is our single most reliable leading indicator.
2. Capacity Divergence Between Parallel Groups
In a 6S3P topology the three parallel cells in each group should age as one. When the computed capacity of one group falls more than 4% behind its siblings, it is being overworked and will become the limiting cell. Divergence of this size preceded 84% of the thermal-runaway-near-misses in our audit.
3. Self-Discharge K-Value Drift
The K-value — open-circuit voltage relaxation over 24 hours — is a proxy for micro internal shorts. A stable pack sits below 1.0 mV/day. A pack climbing past 2.5 mV/day is a retire-now signal; in our data it correlated with a 22% probability of a hard internal short within 40 cycles.
4. Thermal Spread Widening
We measure the spread between the hottest and coolest parallel-group temperature at end-of-loiter. A widening spread (more than +3°C versus baseline) tells us a group is losing thermal contact or gaining resistance, often from a loosening busbar. It is usually the last warning before a mechanical failure, so we weight it heavily.
Correlating Failures to Mission Parameters
Raw signatures are useful, but the real leverage comes from correlating them to how the aircraft actually flew. When we overlaid DCIR-creep rate against mission altitude and ambient temperature, a clear pattern emerged: flights launched below 5°C at altitudes above 3,000 meters showed DCIR growth 18% faster than sea-level warm flights, even at identical discharge rates. The mechanism is straightforward — cold electrolyte has higher viscosity, lithium plating risk rises during the recharge, and the thin-air thermal plateau removes the pack’s only easy path to shed heat.
We now tag every flight with a “stress score” built from altitude, ambient, payload mass, and loiter duration, and we feed that score into the trend analysis. A pack that looks healthy in absolute terms but is accumulating stress far faster than its peers gets pulled for inspection early. This is how we caught a fleet of 12 packs that were all quietly aging ahead of schedule because they flew the high-altitude winter corridor — none had tripped an absolute threshold yet, but the rate-of-change model flagged all 12 inside one week.
From Detection to Action: RUL Estimation and the Go/No-Go Gate
Telemetry only matters if it changes behavior, so we close the loop with a remaining-useful-life (RUL) estimate and an automated go/no-go gate. For each pack we fit a linear drift to the four signatures and project the week at which any single indicator crosses its retirement limit. We set the retirement limits conservatively: DCIR > 1.6× baseline, any group capacity < 80% of nameplate, K-value > 2.5 mV/day, or thermal spread > 8°C.
Every pack carries a live RUL readout in the operator dashboard. When projected RUL drops below six weeks, the system issues a soft advisory and schedules the pack for a bench confirmation. When a hard limit is tripped, the gate blocks that pack from the next mission manifest automatically — no human has to remember. Across our managed fleet this gate prevented an estimated 31 in-field under-voltage events last year and cut unplanned mission aborts by 44%.
Closing the Loop: How Telemetry Shapes the custom battery solution
The most valuable output of an early-warning program is not the alerts — it is what they teach us about design. Every flagged failure feeds back into our engineering queue. When the high-altitude cold-corridor data showed accelerated creep, we responded with a custom battery solution that added a thin self-heating film between the cell layer and the enclosure, trimming cold-recharge plating risk and cutting winter DCIR growth by roughly a third in field trials. When thermal-spread data pointed at loosening busbars, we moved from spot-welded nickel to laser-welded copper busbars on the next revision.
This is the discipline I would urge any survey operator to adopt: treat your fleet’s telemetry as a continuous design review. The packs we ship today are not the packs we shipped two years ago, precisely because the data told us where they were weak. Every Horizon Power mapping pack is built to UN 38.3 (T.1–T.8), qualified to IEC 62133-2, and air-transport compliant under FAA and EASA 100 Wh limits with IATA Section II handling for the logistics between survey sites.
Frequently Asked Questions
How many flight hours of telemetry do I need before early-warning works?
You do not need a huge historical dataset to start. A single pack develops a usable baseline after about 15 to 20 flights, and fleet-level pattern detection becomes reliable once you have roughly 2,000 flight-hours aggregated. The rate-of-change model is what makes even modest data useful — you are comparing a pack against its own trend, not against a universal standard.
Can I retrofit telemetry onto an existing drone lithium battery pack?
Yes, within limits. Adding a voltage and current logger with a temperature probe is straightforward and non-invasive. Capturing per-cell AC-impedance in the field requires a small sensing board on the BMS bus, which is cleaner to specify at build time. For retrofits we usually get three of the four signatures and still catch the majority of failures.
What DCIR creep rate should trigger retirement?
We use 0.4 mΩ increase per 20 cycles as the advisory line and 1.6× the pack’s own baseline as the hard retirement limit. The reason we anchor to each pack’s baseline rather than an absolute number is that chemistries and topologies differ; a fixed threshold either retires good packs or keeps bad ones flying.
Does cold-weather mapping really accelerate wear that much?
In our data, yes — cold high-altitude flights showed DCIR growth about 18% faster than warm sea-level flights at the same discharge rate, driven mainly by lithium plating during recharge and collapsed convective cooling. The fix is thermal management, not just a lower operating limit. A pack with no cold-mitigation strategy will age noticeably faster in a winter survey program.
How does the early-warning system stay compliant with air-transport rules?
The telemetry and logging hardware add no hazardous material and do not change the cell chemistry, so transport classification is unchanged. Packs under 100 Wh still ship as carry-on-equivalent under FAA and EASA rules with IATA Section II documentation, and we keep the UN 38.3 test summary on file for every production lot. The early-warning data lives in your logs, not inside the battery.