Drone Battery Reliability for Mapping UAVs: Designing an
When a survey contractor signs a multi-year mapping contract, the first question I get from their flight-operations lead is never about energy density. It is: “How do you prove this drone battery will still be reliable in eighteen months, not just on day one?” Certification tells you a pack is safe to ship; it does not tell you how many survey cycles it will survive before its failure rate climbs. As a senior lithium battery engineer at Horizon Power, my job is to close that gap with evidence. The tool we rely on is an Accelerated Life Test (ALT) program built on physical acceleration models — most importantly the Arrhenius temperature relationship — so we can predict field reliability for mapping UAVs in weeks instead of waiting through a full deployment season.
Why Mapping Fleets Cannot Wait 18 Months for Field Data
A mapping UAV lives a harder life than the spec sheet suggests. A typical orthophoto or LiDAR survey is a long, shallow loiter at low altitude with a gimbal and payload drawing steady current, interleaved with aggressive climb and descent. That duty cycle is different from a delivery drone’s point-to-point sprint, and it stresses interconnects and cell balancing in its own way. More importantly, a fleet operator flying a dozen aircraft needs a reliability commitment before commissioning, because their own service-level agreement depends on it.
Waiting for real field returns means an 18-month blind spot. An accelerated life test lets us compress that timeline: by raising controlled stresses in the lab, we age packs faster than they would age in the field, then use a physics-based model to translate the results back into equivalent field flight-hours. Done correctly, it is not a guess — it is an extrapolation grounded in the same chemistry that governs real fade.
The Physics of Acceleration: Choosing the Right Stress Models
You cannot simply “test hotter and hope.” A credible ALT maps each applied stress to a known acceleration law. For a drone lithium battery we use four:
- Temperature — Arrhenius. Reaction-rate-limited degradation follows AFtemp = exp[(Ea/k)(1/Tuse − 1/Tstress)], where Ea is the effective activation energy (we use ~0.7 eV for the dominant SEI growth mechanism in our cells), and k is Boltzmann’s constant (8.617 × 10⁻⁵ eV/K).
- Current rate — Inverse Power Law. Higher C-rate accelerates lithium plating and joule heating: AFcur = (Istress/Iuse)n, with n ≈ 1.5 for the graphite-anode chemistry we deploy.
- Thermal cycling — Coffin-Manson. Joint and weld fatigue from altitude-driven temperature swings scales with ΔT: AFcyc = (ΔTstress/ΔTuse)c, c ≈ 2.0 for soldered interconnects.
- Vibration — Miner’s rule. Cumulative damage from the gimbal-induced random-vibration spectrum is summed linearly across stress levels.
The key engineering discipline is to keep each stress inside the regime where its model stays valid. We never raise temperature so high that a new failure mode appears — if a 70 °C test triggers separator shrinkage that a 25 °C field never sees, the acceleration factor is meaningless. We bound the test window using differential scanning calorimetry and rate-data from earlier abuse programs.
Model validation is not a one-time checkbox. Before a full ALT campaign, we run a short “calibration” subset at two temperatures only and confirm the measured acceleration ratio matches the Arrhenius prediction within ±15%. If it does not, the assumed activation energy is wrong for that cell chemistry and we re-derive Ea from the calibration data rather than forcing the standard 0.7 eV value. This step is what separates a defensible reliability claim from a laboratory artifact, and it is the part less experienced suppliers skip.
Designing the ALT Matrix for a Mapping Pack
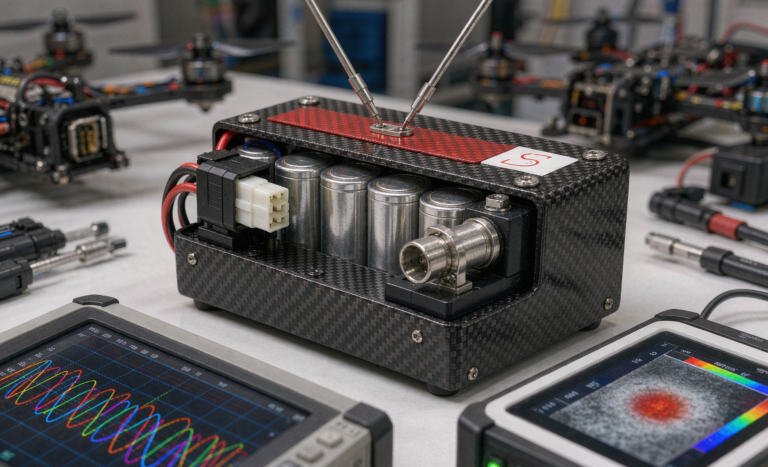
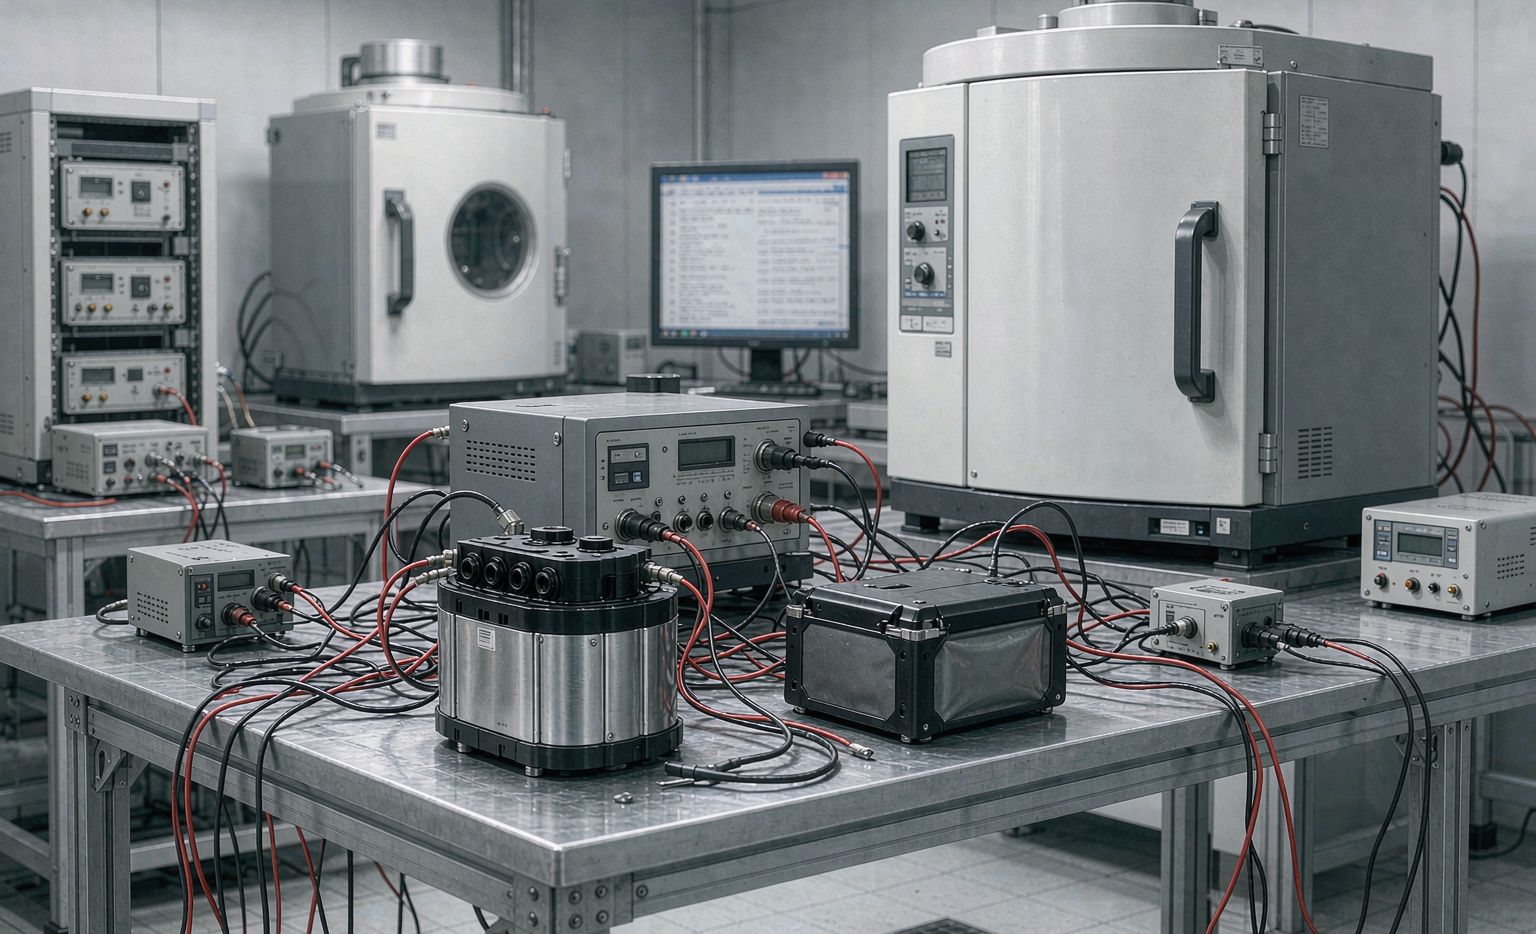
For our 6S3P 97.7 Wh mapping module, the test plan is a two-factor matrix: three chamber temperatures (45 °C, 55 °C, 65 °C) crossed with two discharge C-rates (2C and 3C), using twenty packs total with at least four replicates per cell. Each pack runs a mission-profile waveform captured from real survey flights — loiter plateau at 0.8C, climb bursts at 3C, recharge at 1C with a hot-soak hold — rather than a simple constant-current loop, because the waveform itself drives the damage.
Every pack carries a 4-wire Kelvin sense and a centre-cell NTC so we track DC internal resistance (DCIR) and cell-to-cell temperature spread online. We screen incoming cells to a tight spec — capacity spread ≤ 1%, DCIR coefficient of variation < 6%, and self-discharge K-value < 1.0 mV/day — so the ALT measures design-and-process reliability, not incoming-lot scatter. Units are pulled at scheduled intervals for teardown: cross-section microscopy of welds, electrolyte wetting inspection, and impedance spectroscopy to catch the early knee before capacity loss is visible.
Chamber control is tighter than most people expect. We hold the soak temperature to ±1 °C and log at 10 Hz so a transient thermal overshoot during a fast recharge cannot quietly inflate the acceleration factor. Charge is terminated on a −ΔT cutoff rather than a fixed timer, mimicking how the field battery management system ends a cycle, because a timer-based cutoff over-charges hot cells and manufactures a failure mode that never occurs in operation. Getting these details right is the difference between an ALT that predicts the fleet’s life and one that merely destroys packs expensively.
Converting Accelerated Cycles to Equivalent Field Flights
This is where the Arrhenius math earns its keep. Take a pack tested at 55 °C and 3C:
- Temperature factor: AFtemp = exp[(0.7 / 8.617e-5)(1/298.15 − 1/328.15)] ≈ exp(2.50) ≈ 12.1.
- Current factor: AFcur = (3/1)1.5 ≈ 5.2.
- Combined AF ≈ 12.1 × 5.2 ≈ 63.
One accelerated cycle therefore represents roughly sixty-three equivalent field cycles. If a four-pack subset reaches its B10 life (10% failed) at 2,000 accelerated cycles, that translates to about 126,000 survey flights — and a single mapping mission is close to one equivalent cycle of our duty profile. For a 12-aircraft fleet flying ~15 missions per aircraft per day, that is on the order of two years of fleet operation demonstrated in roughly five weeks of bench testing. The number is defensible precisely because every term in the acceleration model is measured, not assumed.
Setting a Demonstrated Reliability Milestone
A raw B10 point is not enough; we have to state our confidence. We treat the ALT as a reliability-demonstration test and analyze it two ways. The simple path is a binomial pass/fail at a target: “demonstrate ≤ 1% early-life failure at 90% confidence” using the rule that zero failures in n units gives 90% confidence only when n ≥ 23. The richer path is a two-parameter Weibull fit on the failure times, where the shape parameter β diagnoses the failure regime — β < 1 signals infant mortality (a process escape we must fix), β ≈ 1 is random, and β > 1 is wear-out, which is what a mature pack should show.
We set the demonstrated milestone as a field B10 life with a one-sided lower confidence bound, then compare it against the operator’s required mission count. If the lower bound clears the contract, the custom battery solution is released with a written reliability commitment. If it does not, the data tells us exactly which lever to pull — usually tightening the weld spec or lowering the upper charge voltage from 4.20 V to 4.15 V, which our ALT shows extends B10 by roughly 20% at a 4% energy penalty.
Closing the Loop: From ALT Evidence to a Field-Ready Pack
The ALT program does not end at a report. Its outputs feed three things. First, the qualification gate: no mapping pack ships to a fleet customer without the ALT evidence package, which we align with UN 38.3 (T.1–T.8) and IEC 62133-2 as the safety floor and the ALT as the reliability proof above it. Second, the operations rule-set: the DCIR and spread thresholds we validated become the in-field go/no-go gate for the fleet’s own telemetry. Third, the design feedback loop — every ALT teardown that shows a specific wear mode (interconnect fatigue, electrolyte dry-out, balance-circuit drift) becomes an engineering change order in the next revision.
For a BVLOS mapping operation under EASA SORA or FAA Part 107, that closed loop is what turns a battery from a consumable into a managed, predictable asset. The drone battery you fly today is only as reliable as the test program that qualified it.
FAQ
What is an accelerated life test for a drone battery?
An accelerated life test ages battery packs faster than field use by raising controlled stresses — temperature, current rate, thermal cycling, and vibration — inside validated physical models, so engineers can predict field reliability in weeks instead of waiting through a full deployment season.
How does the Arrhenius model predict battery life?
The Arrhenius relationship, AF = exp[(Ea/k)(1/Tuse − 1/Tstress)], quantifies how much faster a temperature-driven degradation reaction proceeds at the test temperature versus the field temperature. Multiplying it by the current-rate factor gives a combined acceleration factor that converts lab cycles into equivalent field flight-hours.
Is accelerated testing as reliable as real field data?
It is reliable only when every stress stays inside the regime where its acceleration model is valid and no new failure mode is introduced. We bound the test window with calorimetry and rate data, and we confirm the ALT’s predictions against the first months of real fleet telemetry before committing a long-term reliability number.
What standards apply to mapping UAV battery reliability?
Safety certification uses UN 38.3 (T.1–T.8) and IEC 62133-2, while air-operation bands are governed by FAA Part 107 and EASA SORA. The ALT program sits above that safety floor as the engineering evidence for field reliability and expected cycle life.
How many test packs are needed for a credible ALT?
We use a two-factor matrix of at least twenty packs with four or more replicates per cell so the Weibull fit and the confidence bound are statistically meaningful. Demonstrating a low early-life failure rate at 90% confidence alone requires roughly two dozen units even with zero observed failures.