Lithium Battery State of Health Estimation Methods
Why State of Health Is the Number Operators Actually Care About
When I walk a procurement team through a new pack program, the spec sheet always leads with capacity, voltage and cycle life. Those matter. But the metric that quietly decides whether a fleet stays in service past year three is State of Health (SOH). I am Karl Huang, Senior lithium battery Engineer at Horizon Power, and over the last decade I have qualified hundreds of lithium battery packs for industrial, telecom and mobility programs. SOH is the single value that tells you how much usable life a cell or pack has left — and most buyers misunderstand it until a pack fails a field audit.
In plain terms, a brand-new lithium battery leaves the line at 100% SOH. As it ages through charge and discharge, two things erode that number: available capacity drops and internal resistance climbs. When SOH falls far enough, the pack can no longer deliver the current or runtime the application was designed around, even if it still “charges fine” on the bench. That gap between “looks healthy” and “actually healthy” is exactly where SOH estimation earns its keep.
What State of Health Really Measures
SOH is normally expressed as a percentage relative to the cell’s initial rated condition. The two accepted reference points are:
- Capacity fade SOH — the ratio of current full charge capacity to the original rated capacity (Ah).
- Resistance growth SOH — the ratio of original DC internal resistance to the current resistance, which captures power fade.
In my lab, I report both. A pack can lose 15% of its capacity while its resistance barely moves (typical of a lightly used LFP battery), or it can hold capacity but spike in resistance (more common in abused NCM battery cells that have seen deep discharge and high temperature). Either one shortens the safe working window. For a 12v lithium battery used in standby power, resistance growth is often the earlier failure signal; for an e-mobility pack, capacity fade dominates the complaint.
We anchor every SOH baseline to standardized formation and grading data, and we validate against IEC 62133 capacity and impedance test conditions so the number means the same thing across batches and auditors.
Coulomb Counting and Capacity-Based SOH
The most defensible SOH estimate is still the direct one: fully charge the cell, then discharge it at a defined rate to the cut-off voltage while integrating the current. The measured ampere-hours divided by the rated ampere-hours is your capacity SOH. For a lithium-ion battery pack this is usually done at 0.2C or 0.5C reference rate, the same rate used in cell datasheets.
The catch is practicality. A full discharge means taking the asset offline, which is why capacity-based SOH is common in incoming inspection and warranty arbitration but rare as a live field method. On the factory floor I run it on a sample of every lot; in the field I reserve it for packs flagged by faster methods. The discipline pays off: a capacity check settles more “my pack died early” disputes than any model ever will, because it is a measurement, not an inference.
Internal Resistance and Electrochemical Impedrical Spectroscopy
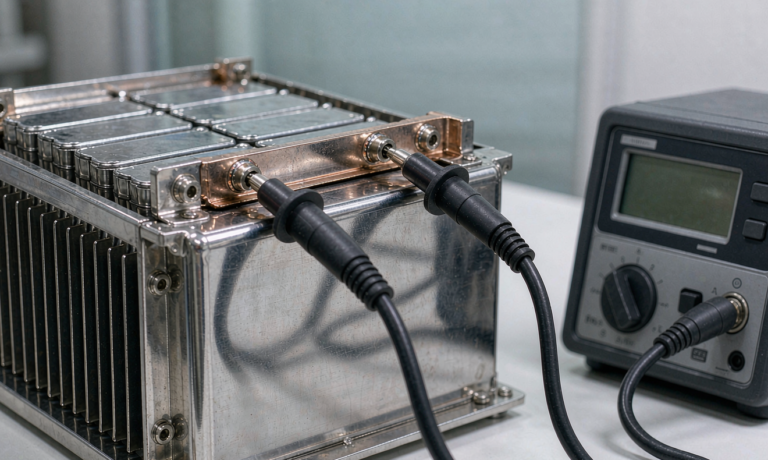
When you cannot spare a full cycle, impedance tells the story. A simple DC resistance measurement — pulse a known current and read the voltage step — catches gross degradation. But the richer signal is Electrochemical Impedance Spectroscopy (EIS): sweep a small AC signal across frequency and read how the cell responds. EIS separates the contributors — ohmic resistance, charge-transfer resistance, and diffusion — so you can see whether a pack is aging from electrode cracking, electrolyte dry-out or lithium plating.
For high-value lithium battery pack programs I spec EIS as a quarterly health check. It is non-destructive, takes minutes, and the spectra are repeatable enough to trend quarter over quarter. The limitation is that EIS needs calibrated hardware and a clean reference; in a dusty field cabinet it is less reliable than a well-modeled coulomb count.
Model-Based Estimation: Kalman Filters and Equivalent Circuits
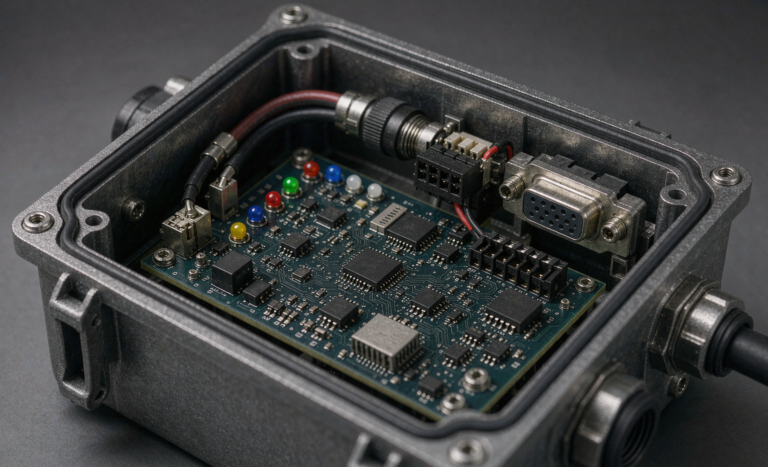
Most live SOH lives inside the BMS solution. The controller cannot stop production to run an EIS sweep, so it infers SOH continuously using a battery model. The workhorse is the Extended Kalman Filter (EKF) paired with an equivalent-circuit model — a few resistors and capacitors that mimic the cell’s voltage response.
Here is how it works in practice. The BMS measures terminal voltage and current every cycle. The EKF predicts the cell’s state and then corrects itself against the measured voltage, slowly converging on an SOH estimate. A more robust variant, the particle filter, handles the non-Gaussian noise you get in real fleets. In my experience a tuned EKF holds within 3–5% SOH of a bench capacity test across most of a pack’s life, which is more than good enough for predictive maintenance. The failure mode is a bad model: if the equivalent-circuit parameters are wrong for your chemistry, the estimate drifts, and you either retire packs early or miss a failing one.
Data-Driven and Cloud Methods
The newest wave is machine learning on fleet telemetry. Instead of a hand-tuned model, you feed thousands of charge cycles — voltage curves, temperature, rest time, historical SOH labels — into a training pipeline and let it learn the degradation signature. Cloud platforms now aggregate this across an entire fleet, so a pack in one warehouse benefits from the failure patterns seen in another.
I have deployed this for a telecom backup program where 12v lithium battery strings sit idle most of the time and only discharge on outages. Traditional coulomb counting saw almost no cycling, so SOH barely moved on paper while real calendar aging accumulated. The data-driven model picked up the subtle capacity creep from high ambient temperature that the simple estimator missed. The lesson: for low-cycling assets, you need a model that respects calendar aging, not just cycle counting.
How SOH Connects to Safety and Certification
SOH is not only a commercial metric; it is a safety one. A pack that has lost capacity but gained resistance runs hotter under load, and heat is what pushes a lithium-ion battery toward thermal runaway. That is why we tie SOH thresholds into the protection logic of every custom battery solution we ship for critical applications.
The certification framework reinforces this. UN38.3 governs the transport safety of cells and packs and assumes a known, healthy condition; once a pack’s SOH degrades, its transport classification and handling must be re-examined. IEC 62133 sets the safety requirements for portable cells and defines the test conditions under which capacity and robustness are judged. For aviation-linked programs, FAA and EASA expectations push operators to retire packs before they become unpredictable. My rule of thumb: set the retirement trigger at 80% SOH for energy-critical loads and 70% for non-critical standby, then verify the BMS enforces it.
A Practical SOH Workflow for Buyers
If you are sourcing a lithium battery pack and want SOH you can trust, specify it in the RFQ rather than hoping it appears. Ask for:
- The SOH reference method (capacity-based, resistance-based, or both) and the test rate.
- The estimation algorithm inside the BMS solution and its stated accuracy window.
- Whether the pack reports SOH over the communication bus (CAN, SMBus, or Modbus) for your fleet software.
- The retirement threshold and how it is enforced in firmware.
- Traceability: each pack should carry formation and grading data so its 100% baseline is documented, not assumed.
When we build a custom battery solution for a client, SOH reporting is part of the acceptance test, not an afterthought. The packs that survive longest in the field are the ones whose operators trusted the number and acted on it — replacing at threshold instead of waiting for a failure.
Frequently Asked Questions
How accurate is SOH estimation in the field?
A well-tuned model-based estimator inside a BMS solution typically lands within 3–5% of a bench capacity test for most of a pack’s life. Accuracy drops near the extremes — very new or very old packs — where you should confirm with a direct capacity measurement.
At what SOH level should a lithium battery be retired?
For energy-critical or safety-related loads I recommend retiring at 80% SOH. For non-critical standby such as a 12v lithium battery backup, 70% is a pragmatic floor. The exact number should be written into the BMS protection logic.
Can SOH be estimated without a full discharge?
Yes. Impedance methods (DC pulse or EIS) and model-based estimators running inside the BMS infer SOH from normal cycling without taking the asset offline. A full discharge remains the reference check, not the daily method.
Does temperature affect SOH readings?
Temperature affects both the true degradation and the measurement. Cold cells show temporarily higher resistance, which can understate SOH if uncorrected. Good estimators temperature-compensate; cheap ones do not, which is why I always ask about the model’s thermal correction.
How does a BMS solution report SOH to my system?
Most BMS controllers expose SOH over a digital bus — CAN, SMBus or Modbus — as a percentage value updated each cycle. For fleet visibility, make sure the value is forwarded to your monitoring platform rather than sitting buried in the pack.
Is SOH the same as State of Charge?
No. State of Charge (SOC) is the instantaneous fill level, like a fuel gauge; State of Health (SOH) is the long-term condition of the cell. A pack can read 100% SOC and only 75% SOH — full, but worn.