Semi-Solid State Battery Cost Model and BOM Breakdown: An Engineer’s Teardown of Cell Pricing
When procurement teams ask me for a semi-solid state battery cost model BOM, they usually expect a single number on a slide. After fifteen years on the lithium battery line — most recently as senior lithium battery engineer at Horizon Power — I tell them the honest truth: there is no single number. A semi-solid state battery is a layered electrochemical system, and its price is the sum of materials, manufacturing yield, and the energy density you are willing to pay for. In this teardown I will walk through a realistic bill of materials for a 50 Ah prismatic semi-solid state cell, show where the dollars actually go, and explain which line items you can shrink without hurting performance. If you are scoping a custom battery solution, this is the math you should be negotiating from.
Why a Semi-Solid State Battery Cost Model Is Not Just LFP With Extra Steps
The first mistake buyers make is treating every lithium battery as if it were the same chemistry with a different label. A conventional LFP pouch and a semi-solid state battery share roughly 60% of their hardware — aluminum and copper current collectors, housing, tabs, and a good chunk of the formation process — but the electrolyte and electrode architecture are where the cost story diverges. In a semi-solid state design the electrodes stay thick and the liquid fraction drops to roughly 5–15% by weight, held in a gel-like matrix instead of a flooded separator. That single architectural choice changes the bill of materials in three ways: less electrolyte to buy, a thinner or partially removed separator, and higher active-material loading per square meter of electrode.
From a cost-modeling standpoint the implication is simple: you are trading some electrolyte savings and separator savings for a more expensive cathode loading and a tighter coating process. Whether that trade is net positive depends entirely on the energy density you are targeting. For a drone battery that needs to shed every gram, the premium is usually justified. For a stationary home unit where weight is irrelevant, it often is not — yet.
The Bill of Materials: What Actually Sits Inside a 50 Ah Cell
Let me ground this in a real example. The numbers below come from a cell we built on our pilot line: a 50 Ah prismatic semi-solid state cell, 3.7 V nominal, roughly 210 Wh/kg at cell level. I have rounded to keep the teardown readable, but the proportions are what matter.
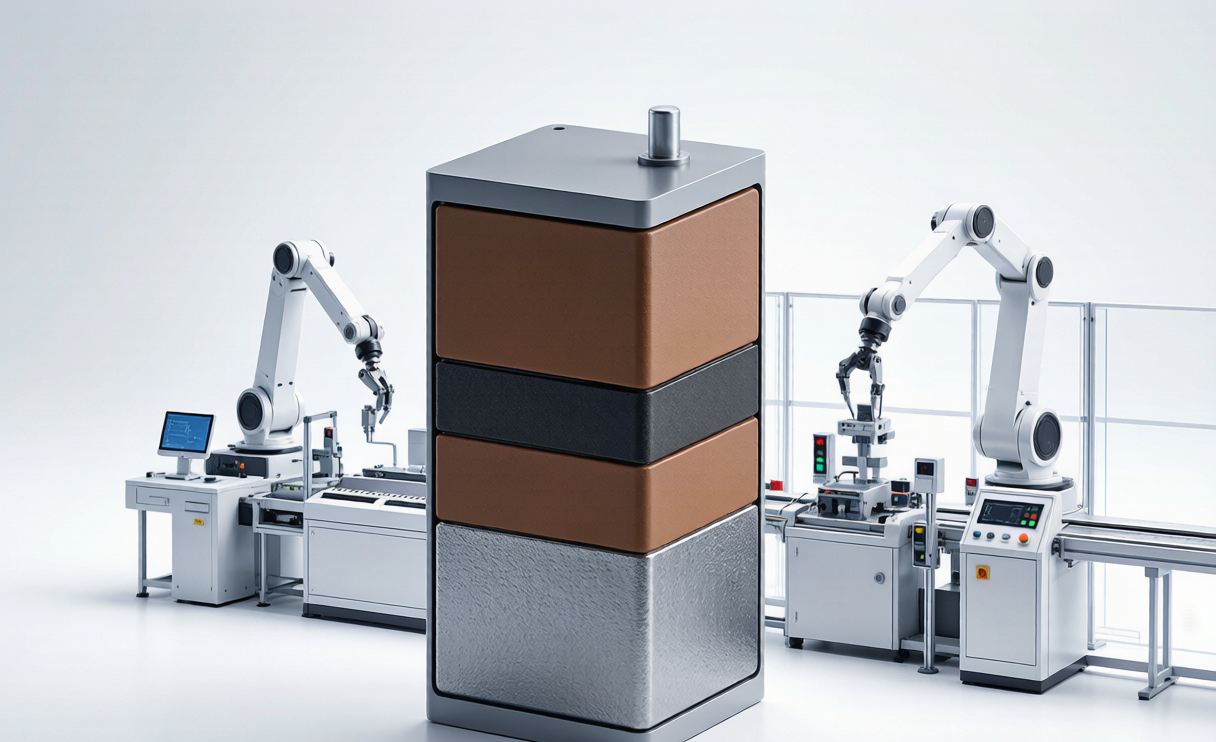
- Cathode active material (NMC811 or LMFP blend): ~38% of total cell cost. This is the dominant line item in almost every semi-solid state battery cost model.
- Conductive carbon + binder system: ~4%. Low absolute cost, but it scales with cathode mass.
- Semi-solid electrolyte matrix: ~9%. Lower than the 12–15% you would see in a flooded liquid lithium battery because far less solvent is needed.
- Separator (thinned or partial): ~3%. Often the biggest single saving versus conventional liquid cells.
- Anode (graphite + 5% SiOx): ~7%. Silicon content is the lever here — more SiOx raises cost but lifts energy density.
- Current collectors (Al / Cu foil): ~8%. Tied to metal commodity prices, which is why we hedge quarterly.
- Housing, tabs, insulation, BMS interface: ~14%. Mechanical parts, largely commodity.
- Manufacturing overhead, yield loss, formation: ~17%. The hidden tax that separates a spreadsheet BOM from a shipped product.
Notice that materials alone do not sum to 100%. The last bucket — yield loss and formation energy — is where many cost models quietly fall apart, because it is the one number a supplier controls least and a buyer audits least.
Cathode Active Material: The Dominant Cost Driver
If you remember one thing from this semi-solid state battery cost model BOM, remember this: the cathode is the budget. At a typical loading of 3.2–3.8 mAh/cm² and an active-material cost around $18–26 per kg depending on nickel price, cathode CAM can run $28–40 per kWh of cell capacity. Push loading higher and you buy less foil and less housing per kWh — that is the core reason a semi-solid state architecture can close the gap with LFP at the pack level even when $/kg looks worse.
In our engineering reviews I push cathode loading as high as coating yield allows. Every 0.2 mAh/cm² of extra loading typically shaves 2–3% off pack-level $/kWh, but it also raises the risk of soft shorts if the semi-solid electrolyte does not wet evenly. That is a trade I qualify with UN38.3 T.1–T.8 abuse testing and IEC 62133-2 internal-short validation before any production ramp.
Semi-Solid Electrolyte: The Saving You Are Actually Buying
The headline benefit of moving from a flooded liquid cell to a semi-solid state battery is electrolyte reduction. You simply need less solvent, less separator, and less of the expensive lithium salt. In our BOM the electrolyte plus separator line sits near 12% combined, versus 18–22% on a comparable high-nickel liquid cell. That 6–10 point saving funds most of the cathode premium discussed above.
The catch is process control. A semi-solid electrolyte must be coated uniformly at thicknesses under 40 µm, and the gel must remain ionically conductive after compression. We monitor coating weight with inline X-ray and reject lots outside ±2%. That inspection step is cheap relative to a field failure — and it keeps us aligned with IEC 62619 for industrial cells and UL 1973 for stationary modules.
Manufacturing Capex and the Yield Tax
Materials are only half the semi-solid state battery cost model BOM. The other half is what happens on the line. A semi-solid state cell can be made on a retrofitted lithium battery line — we did exactly that — but two process steps dominate cost: dry-room occupancy and formation.
- Dry room: Semi-solid slurries are less moisture-sensitive than full liquid electrolytes, so we run at <1% RH instead of the <0.5% demanded by some liquid lines. That alone cuts HVAC energy roughly 20–30%.
- Formation and aging: Every cell spends 12–24 hours on a formation cycler drawing grid power. At industrial electricity rates this is a real line item, not rounding error.
- Yield: Our pilot line runs at ~88% first-pass yield. Every point of yield lost adds roughly 1.1% to unit cost. A production line at 95% yield is the single biggest lever on $/kWh after cathode loading.
This is also where a custom battery solution pays off: when we design the cell around the customer’s actual voltage and form factor, we eliminate the die-cut scrap and the repackaging steps that inflate general-purpose BOMs.
The Path to Lower $/kWh: Volume, Loading, and Supply Chain
Looking at the full semi-solid state battery cost model BOM, three forces move the number most:
- Volume: At 1 GWh/year the fixed overhead per kWh is roughly 3× what it is at 5 GWh/year. Scale is the blunt instrument.
- Cathode loading: As noted, higher loading directly cuts foil, housing, and assembly cost per kWh.
- Domestic cathode and salt supply: Shipping CAM across continents adds 4–7% in logistics and tariff. Localizing supply is the quiet win most buyers ignore.
For aerial and mobility programs — think a high-energy drone battery pack or an electric bus — the weight savings from a semi-solid state architecture often outweigh a 10–15% cost premium versus LFP, because the platform saves money elsewhere (smaller thermal system, lighter structure). That is the argument I make to program managers: don’t compare cell $/kWh in isolation, compare system $/kWh.
Frequently Asked Questions
How much does a semi-solid state battery cost per kWh today?
For production-volume prismatic cells in 2026, expect roughly $95–130 per kWh at the cell level and $120–165 per kWh at the pack level, depending on cathode chemistry and order size. A custom battery solution with low-volume tooling sits above that range. These figures assume qualified yield above 92%.
Is semi-solid state cheaper than full solid-state?
Yes, and not by a little. Full solid-state cells still carry massive capex for sulfide processing and pressure sintering, and yields are low. A semi-solid state battery typically lands 30–45% cheaper per kWh today because it reuses existing lithium battery coating and stacking lines. It is the pragmatic middle step.
Do semi-solid state cells need the same dry room as a conventional lithium battery line?
No. Because the electrolyte is gelled and low in free solvent, we hold <1% RH rather than the sub-0.5% environment a flooded liquid line demands. That relaxin reduces HVAC capex and operating cost, which is reflected directly in the semi-solid state battery cost model BOM.
When will the semi-solid state battery cost model BOM reach LFP parity?
At the pack level, parity with LFP is plausible around 3–5 GWh/year of qualified volume with high cathode loading, especially if nickel and lithium salt prices stay contained. Cell-level parity is harder because LFP’s cathode is intrinsically cheap, but the system-level math already favors semi-solid state in weight-sensitive applications.
Conclusion
A credible semi-solid state battery cost model BOM is not a single figure — it is a stack of material, process, and yield decisions. The cathode dominates, the electrolyte and separator deliver the savings that pay for it, and manufacturing yield decides whether the model survives contact with reality. If you are building a custom battery solution and want the numbers to work, start the conversation at cathode loading and dry-room spec, not at the headline $/kWh. That is where the real money is, and where a good engineering partner earns their fee.