Semi-Solid-State Battery Manufacturing Capex Guide
I have spent eleven years on cell lines, and the questions that come out of procurement meetings these days are rarely about chemistry. They are about money. When a buyer asks what a semi-solid-state battery line costs to build, the honest answer is that the number depends less on the cell format and more on how much of the plant has to stay dry, how tight the electrode tolerances are, and whether the electrolyte is sulfide or a polymer gel. In this guide I will walk through the capex lines that actually move the number, what scale does to cost per kilowatt-hour, what happens to the cost picture once the line is running, and how to read a supplier capex claim without getting handed a brochure written for a trade show.
What Drives Capex in a Semi-Solid-State Line
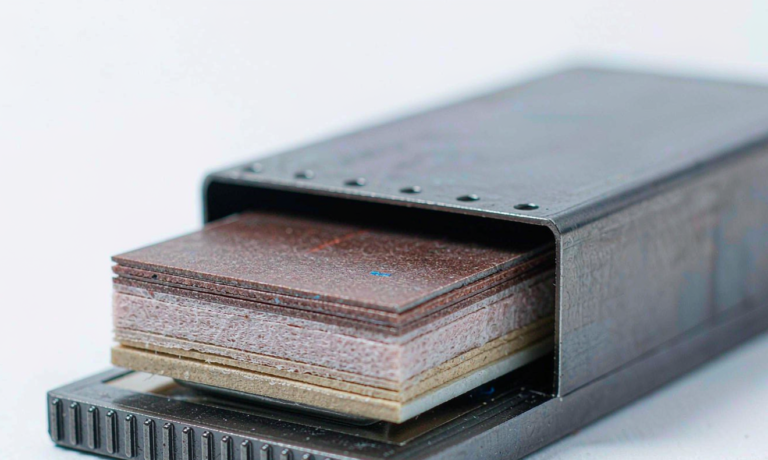
Semi-solid cells carry between 5 and 15 percent liquid electrolyte by weight, with the remainder held in a composite cathode matrix or a thin solid layer. That change is the whole point of the chemistry, but from a capital planning point of view it does not shrink the factory. It re-locates the money.
The main-capex pattern I have seen on four builds is a premium of roughly 1.6 to 2.5 times the capital cost of a conventional liquid-electrolyte line of the same nameplate capacity. The premium comes from three places: a much larger dehumidified area, a membrane or composite cathode casting station that does not exist on a standard liquid line, and tighter lamination hardware that has to hold stack pressure across the whole stack without squeezing the electrolyte layer flat.
If you are comparing quotes, do not compare total plant cost. Compare cost per gigawatt-hour of installed nameplate capacity, and then look at the utilization assumption behind it. Two suppliers can quote the same equipment list and land 40 percent apart once the nameplate baseline differs. Equipment sourced in different regions moves the number again, and so does the question of whether the tooling is depreciated on the buyer side or buried in the cell price.
Watch for the word nameplate in every conversation. A 2 gigawatt-hour nameplate line running three shifts with 80 percent availability does not deliver 2 gigawatt-hours of shippable cells, and the gap between the two is where capex models quietly become fiction.
Where the Money Actually Goes
Dry room and make-up air
Sulfide electrolytes react with moisture at the surface, so the coating and stacking areas have to be held at a dew point of minus 40 to minus 50 degrees Celsius, and in the summer months the make-up air load is punishing. A single cracked window gasket or a door held open during a changeover can push a cell into scrap. On our budgets the dehumidification train, its redundancy, and the classified building envelope run somewhere between 12 and 18 percent of total plant capex. That number is a one-time cost with a permanent energy bill attached, which is why the utilities section matters later in the life of the plant. Compressors, desiccant wheels and the cooling tower behind them are sized for worst case, not average, weather.
Electrode and membrane casting
A semi-solid cathode is cast as a composite with a solid electrolyte phase, which means a second mixing stage, a controlled coating head, and a calender that has to hold electrode porosity within a couple of percentage points. Solvent recovery or, in a true solid process, the solvent-free extrusion step, is a separate capital line of its own. Anything outside tolerance turns into scrap at the cell stage, where it costs five to ten times more to throw away than to reject at the electrode stage, so the cost of a feed screw change is measured in whole shifts rather than hours.
Lamination, stacking and cell assembly
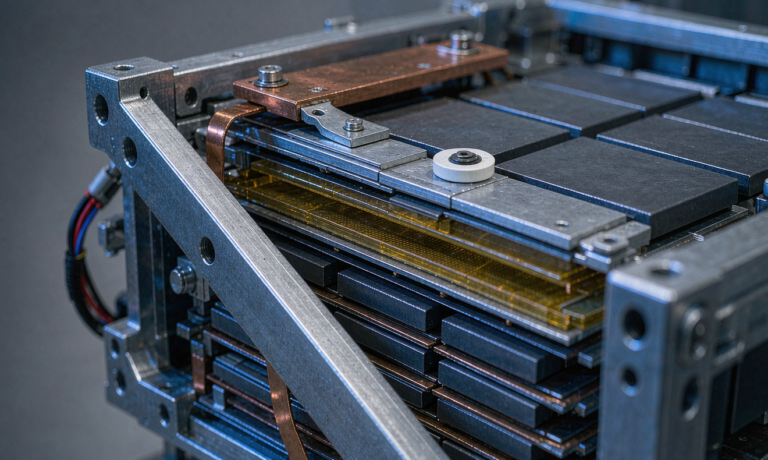
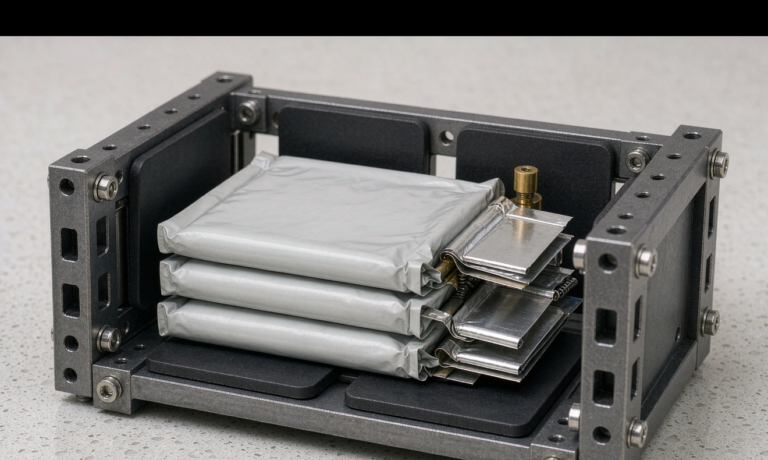
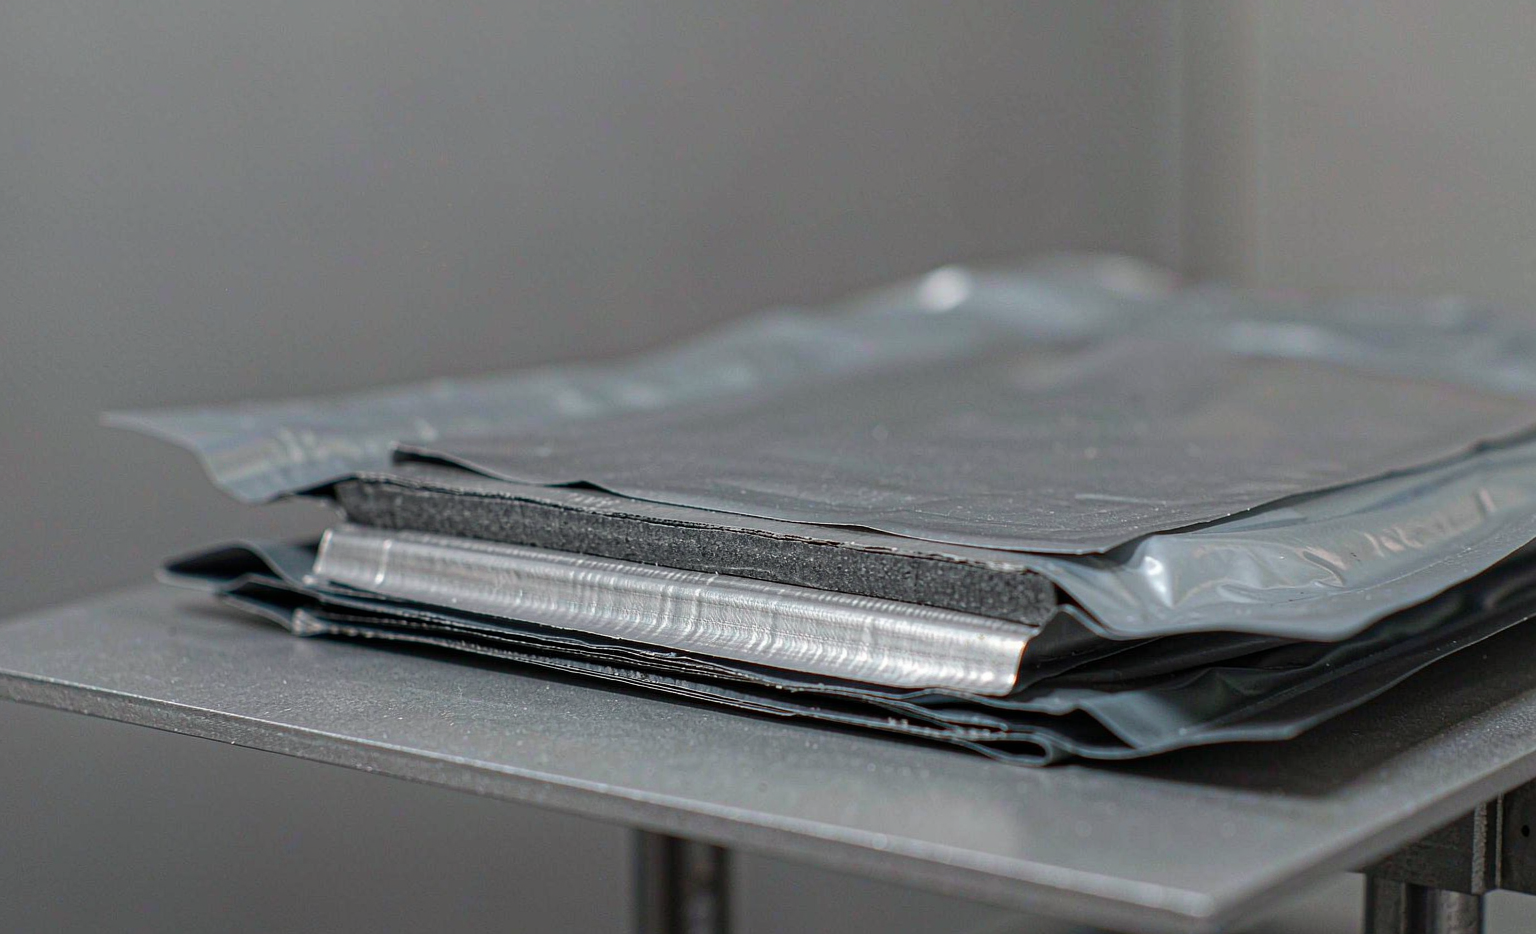
Stack pressure hardware is the quiet cost centre. Applying 0.5 to 3 megapascals uniformly across a stacked pouch and keeping it there through formation requires frames, bladders and tooling that are sized for the longest cell in the family, not the average one. If the pack design team changes the tab position mid-programme, the tooling change is a line stop measured in days. Ask how flexible the press is, how long a format change takes, and whether the bladder set is a consumable you can buy from two vendors.
Electrolyte handling and formation
Even a semi-solid cell still gets a topping dose of liquid, and that dose has to go in under vacuum with dry-dry handling between the drum and the cell. Formation racks, grading racks and the charge/discharge equipment behind them are usually 20 to 30 percent of capex and are frequently left out of a headline number. Charge and discharge capacity is also a utilization question: if the formation hall runs at half the throughput of the assembly hall, the whole line is capped by the slower hall, and you have bought capacity you cannot use.
Scale Economics From MWh Pilot to Gigawatt-Hours
Scale does help, but it helps the tooling bill more than the material bill. On a pilot line running a few megawatt-hours a year, the electrolyte per cell, the dry room and the engineering labour dominate, and the delivered cost per kilowatt-hour looks alarming. That is the stage where most buyer-side surprises start, because a pilot cost per kilowatt-hour is usually quoted as if it were the product price rather than a learning curve snapshot.
Move to a 0.2 to 0.5 gigawatt-hour line and the fixed-cost per unit drops fast, because the same operation gets amortized over a hundred times the volume. Move again to a multi-gigawatt-hour line and the remaining gains come from yield, not from the building. We typically see yield climb from 60 to 80 percent on pilot hardware to 88 to 95 percent once formation cycling and grading are tuned, and each point of yield is worth more than any vendor discount negotiated at the cell level. Maintenance creep also scales with runtime, so the maintenance budget you write at 70 percent utilization will look small by the third year.
For budget planning, treat semi-solid capital at the order of 90 to 150 million USD per gigawatt-hour at early scale, against 40 to 80 million USD for a comparable liquid lithium iron phosphate line. These are planning ranges, not quotations, and the spread between suppliers is wider than the spread inside a single supplier over two years. Depreciation over seven to ten years at better than 70 percent utilization is the assumption I would put in front of a board.
Reading a Supplier Capex Claim
When a supplier tells you their semi-solid cell is cheaper than a liquid prismatic cell, ask four things first. What is the electrolyte grams per kilowatt-hour? What is the first-pass yield at 90 days, not at commissioning? What is the nameplate capacity they used to derive the per-gigawatt-hour figure? And what is the utilization the payback model assumes? Then ask the same four of yourself, because a captive line has to survive a different scrutiny than a merchant purchase.
The answers are usually sitting in the line data, but they are rarely in the deck. I have had a buyer audit where the quoted 0.3 gigawatt-hour line was running at 41 percent utilization and the payback claim only worked at 85 percent. Nothing was dishonest, the model was simply optimistic, and the buyer renegotiated before the agreement was signed.
Total Cost Beyond the Capex Line
Capital is the visible half. The half that decides whether the project is profitable is the operating side: certification, logistics, warranty and residual value. Certification to UN38.3, IEC 62133-2 and IEC 62619 is table stakes for stationary and industrial product, and automotive traction packs add ISO 12405-1 and functional safety work. Each certification cycle also carries a re-test cost, and any design change means starting part of the cycle again.
Moisture-sensitive cells also travel dry and shorter-haul, which quietly pushes landed cost up. Then there is the warranty rate. A semi-solid pack that holds capacity better than liquid in a hot climate looks cheap per kilowatt-hour until you compare the field replacement cost across a fleet of a thousand units, where even a 0.5 percent early-capacity-fade claim rate can exceed the cell margin three times over. Storage and handling at the customer end count too: a pack that needs a desiccant pack replaced before first charge adds a labour line that never appears on the cell invoice.
Frequently Asked Questions
How much more does a semi-solid-state line cost to build than a liquid-electrolyte line?
Budget 1.6 to 2.5 times the capital cost of an equivalent liquid line, with the premium concentrated in dry room capacity, membrane casting and lamination hardware.
Does using less liquid electrolyte lower the manufacturing cost per kilowatt-hour?
Only partly. You spend less on electrolyte solvent drying, but sulfide or composite electrolyte material still costs several times more per kilogram than the carbonate blend it replaces.
What utilization rate do semi-solid lines need to break even?
Above 70 percent is the number I use for planning. Dropping from 85 percent to 50 percent roughly doubles the amortized cost per kilowatt-hour on the same equipment.
Why do semi-solid cell quotations vary so widely between suppliers?
Because nameplate capacity, electrolyte loading, first-pass yield and payback horizon are rarely stated on the same basis. Normalize those four inputs before comparing prices.
Can a conventional liquid line be converted to semi-solid production?
Partially. Mixing, coating and cell assembly can be adapted, but lamination, dry room and electrolyte filling usually need new train equipment rather than an upgrade.
What should a buyer ask before signing a semi-solid supply agreement?
Ask for the dew point log, electrolyte grams per kilowatt-hour, the 90-day yield curve, the capacity utilization behind the payback model, and a second source for electrolyte supply.
Further Reading
References