Home Energy Storage Monitoring Apps and Data
When a customer calls me asking why their home battery backup did not carry the house through a two-hour outage, the first thing I do is open the monitoring app. Nine times out of ten, the data tells the whole story: a missed self-test, a firmware stall, or a load that quietly grew past what the system was sized for. As a senior lithium battery engineer who has commissioned hundreds of residential systems, I have learned that a home energy storage installation is only as good as the visibility you have into it. The hardware is the easy part. Understanding what the data means is what separates a system that quietly saves you money for ten years from one that fails the night you actually need it.
Why Monitoring Matters More Than You Think
Most buyers spec a home energy storage system on capacity and price, then treat the app as an afterthought. That is a mistake. A lithium-iron-phosphate (LFP) pack is a slow, forgiving chemistry, but it is not magic. Cell imbalance, a weak parallel string, or a misconfigured state-of-charge (SOC) window will not announce themselves with a bang. They show up as a gradual, silent loss of usable energy that you only notice when the lights flicker at 80% reported charge.
Good monitoring converts that invisible drift into a number you can act on. It is the difference between finding out your battery is degrading in year three and finding out it is already dead in year eight. From a compliance angle, it also gives you the evidence trail you need: UL 9540 and IEEE 1547-2018 commissioning checks, NEC Article 706 and 710 interconnection records, and the SOC logs that support a warranty claim if a cell falls below specification.
What Data Your Home Battery Backup Actually Produces
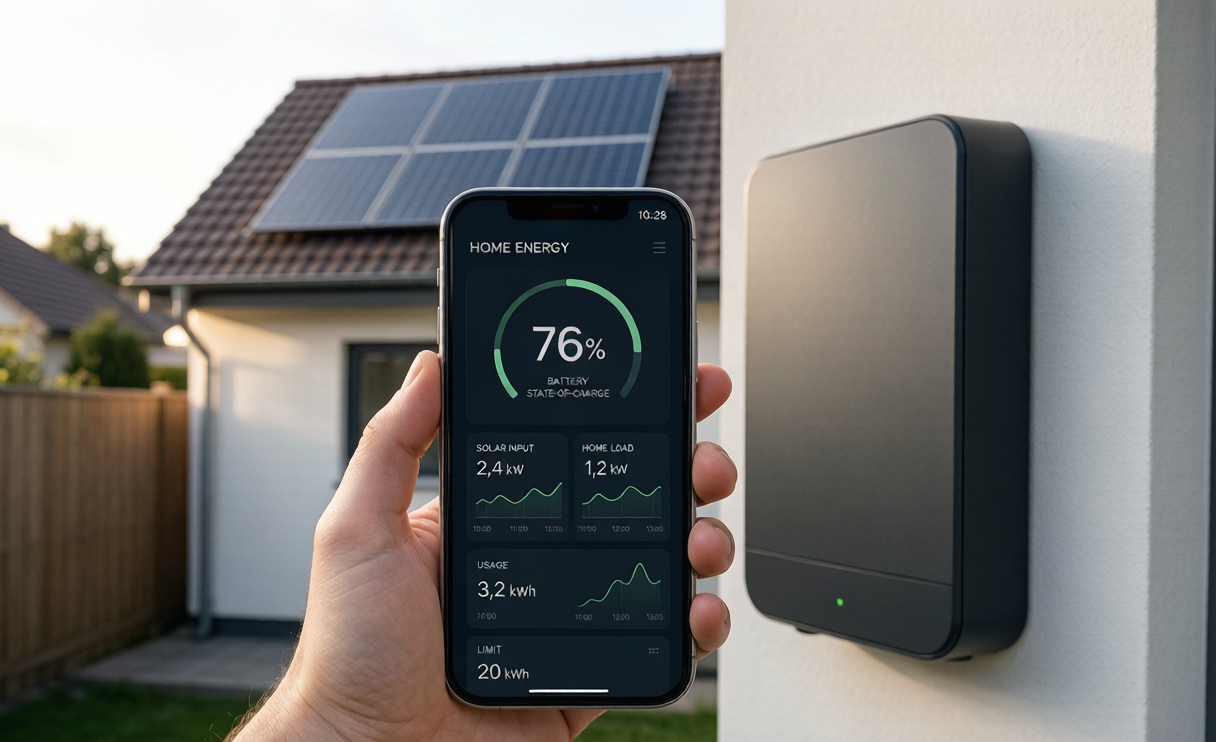
Under the hood, every modern residential battery storage system streams far more than a single battery percentage. The data your system (and its inverter) is generating typically includes:
- State of charge (SOC) and state of health (SOH) at the pack and often cell-group level.
- Charge/discharge power in kilowatts, sampled every few seconds to a minute.
- Voltage and current per string, including temperature at multiple points.
- Energy throughput in kilowatt-hours, the basis for cycle counting.
- Grid status events: outages, reconnects, and frequency deviations.
- PV production and self-consumption when the system is solar-coupled.
- BMS fault and event logs from the battery management system.
In my own test bench, I treat the per-cell voltage spread as the single most diagnostic signal. A healthy LFP pack under a steady load holds cell-to-cell variance under roughly 30–50 mV. When I see that spread climb past 100 mV at half load, I know we have a grading or connection problem long before the customer does.
Types of Home Energy Storage Monitoring Apps
Not all apps are equal, and understanding the three categories helps you pick or pair the right tool.
OEM Native Apps
These come from the battery or inverter brand. They are the most reliable for warranty-grade data because they talk directly to the BMS over a proprietary protocol. The downside is vendor lock-in: they only show you what the manufacturer chooses to expose, and the analytics are often shallow.
Third-Party Aggregators
Platforms that pull from the inverter via Modbus TCP, SunSpec, or an open API give you a unified dashboard across mixed hardware. For homeowners with a third-party inverter and our battery packs, this is usually the fastest path to clean, comparable charts.
DIY and Local-First Systems
For the technically inclined, a Raspberry Pi polling the inverter every second over Modbus, logging to a local database, and visualized in open-source software gives total ownership of the data with no cloud dependency. I run this setup on my own home energy storage lab unit precisely because it removes the internet as a point of failure.
Key Metrics That Actually Predict Battery Health
If you only glance at one screen, glance at these. They are the early-warning indicators I trust in the field:
- Capacity fade rate: Compare full-cycle delivered kWh now vs. at commissioning. Under 2% per year is healthy for LFP.
- Internal resistance trend: Rising resistance means aging cells or loose busbars.
- Self-discharge: A pack that loses SOC overnight is leaking somewhere, often a faulty BMS or a parasitic load.
- Charge acceptance: If the pack stops accepting current well before 100% SOC, a cell group is limiting.
- Thermal signature: Consistently hot strings point to poor ventilation or imbalance.
I tell every client to record a baseline within the first two weeks of operation. That baseline is your reference for every health metric afterward, and it is exactly what our engineers ask for if a pack ever comes back under warranty.
How to Use Data for Tariff Arbitrage and Load Shifting
The fun part is turning data into savings. In time-of-use (TOU) regions, the app is your arbitrage cockpit. A well-set home battery backup charges from grid or solar during off-peak hours and discharges during peak pricing. The data tells you whether your schedule is actually beating the tariff:
- Watch the peak-shaving delta: how much of your evening peak load the battery actually covered.
- Track self-consumption ratio to confirm you are using your own solar instead of exporting it cheaply.
- Use historical load curves to size future discharges instead of guessing.
In one deployment I supported, the homeowner was exporting 60% of midday solar at a low feed-in rate. After we adjusted the charge window using three months of logged data, self-consumption rose to 91% and the system paid back roughly nine months sooner. That change was driven entirely by reading the charts the app was already producing.
Integration, Protocols and Security
Data is only useful if it reaches you reliably and safely. From an engineering standpoint, the protocols matter:
- Modbus TCP/RTU remains the workhorse for inverter-to-logger communication.
- SunSpec models standardize solar and storage data across brands.
- OpenREST or MQTT APIs enable custom dashboards and automation.
- IEEE 1547-2018 governs how the system must behave at the grid edge, and your logs should reflect compliant ride-through behavior.
Security deserves a direct word. A cloud-connected home energy storage system is, by definition, a device on your network that talks to the internet. I recommend: change default credentials, keep firmware current, segment the device on a separate VLAN if you can, and read the vendor privacy policy about where your energy data is stored. Local-first logging avoids the cloud question entirely.
FAQ
Do monitoring apps work if the internet goes down?
It depends on the architecture. Cloud-only apps go blind during an outage, which is ironic for a backup system. Local logging or an on-premises display keeps working. I strongly prefer systems where the BMS and inverter log locally and sync to the cloud when available, so an outage does not also mean blindness.
What is the difference between the inverter app and the battery app?
The inverter app shows grid, solar, and power-flow behavior; the battery app shows pack-level health from the BMS. For a complete picture of your home energy storage you want both, or a third-party dashboard that merges them. Relying on only one leaves half the story untold.
Is my home energy storage data private?
It should be, but verify. Many OEM apps store your load profile on vendor servers. If privacy matters, choose local logging, enable strong authentication, and ask the vendor directly where data resides. Responsible manufacturers are transparent about this; evasive ones are a red flag.
Can I export my data for warranty claims?
Yes, and you should. Most quality systems let you export CSV or JSON of SOC, SOH, temperature, and event logs. Keep those files. They are exactly what an engineer needs to confirm a pack is within IEC 62619 and UL 1973 performance expectations versus a field-abuse problem. Good data turns a dispute into a quick resolution.
The bottom line from my bench: a home energy storage monitoring app is not a gimmick, it is the instrument panel of your power system. Learn to read SOC, SOH, and cell balance, set a sensible TOU schedule from real load data, and keep your logs local and secure. Do that, and your battery will quietly deliver value for a decade instead of surprising you on the worst possible night.