Semi-Solid State Battery Quality Control and In-Line
Hi, I’m Karl Huang. As a senior lithium battery engineer who has commissioned semi-solid state battery pilot lines and transferred them into volume production, I’ve learned one hard truth: the gap between a promising electrode and a shippable cell is metrology. A semi-solid state battery looks like a conventional lithium battery on the outside, but its slurry-free, highly loaded composite cathode and quasi-solid electrolyte place completely different demands on quality control. When a drone battery buyer asks me how we guarantee consistency across 100,000 cells, the honest answer is simple — we measure more, sample less, and trust the line instead of the batch. In this article I’ll walk through the in-line metrology we run every shift, the standards we certify against, and the failure modes that quietly destroy yield when teams treat semi-solid cells like ordinary lithium-ion.

Why Semi-Solid State Battery QC Is Different From Lithium-Ion
The first mistake engineers make is assuming the quality control plan that worked for a wound lithium ion battery will carry over. It won’t. In a classical cell the liquid electrolyte fills every void, so small coating variations get washed out by ionic transport. In a semi-solid state battery the composite cathode carries an extremely high active-material loading — often 90–95% by weight — with only a thin quasi-solid ion conductor. There is almost no margin for a thick spot, a thin spot, or a trapped void. A 2-micron coating drift that is invisible on a graphite anode can become a local hot spot, a high-resistance interface, and eventually a soft short.
That physics forces a different philosophy: move inspection from the lab to the line. We don’t wait for a finished cell to fail a capacity test; we characterize the electrode the moment it leaves the coater. This is what in-line metrology means in practice — continuous, non-contact measurement feeding a closed loop back to the coating head within seconds, not days.
In-Line Coating Thickness and Mass Loading Measurement
The single most important variable on a semi-solid cathode line is uniform mass loading. We run a dual-sensor stack directly after the dryer. A laser-triangulation gauge profiles total wet-and-dry thickness at 500 Hz, while a beta-ray or X-ray backscatter sensor reports areal mass density independent of binder migration. The target window is tight: ±1.5% mass loading across the web width and ±2% down the length of a 200-meter roll.
Why so strict? Because energy density in a lithium battery pack is computed from the weakest parallel group. One under-loaded section pulls the whole module’s usable capacity down, and one over-loaded section becomes the first to delaminate during calendering. We log every 10-millimeter slice to the MES, and any 5-meter section drifting outside ±2% triggers an automatic slowdown and a coating-head purge. This is the kind of discipline a custom battery solution customer expects but rarely sees documented.
Calendering and Porosity Control
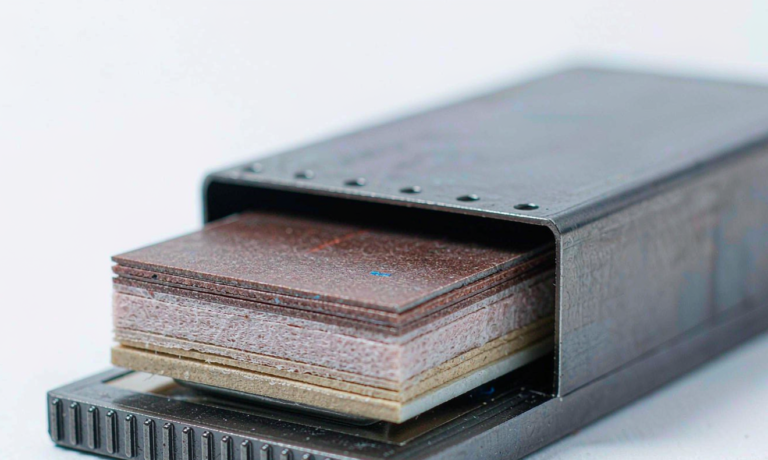
After coating, the electrode is densified by calendering. For semi-solid cathodes the porosity target sits around 25–32%, and the roller gap must hold within 0.5 microns. We use an X-ray density gauge riding the nip to confirm real-time porosity, because compression ratio drives both ionic pathway length and interfacial contact.
Over-calender and you crush the ion-conducting network; under-calender and the cathode separates from the current collector on the first thermal cycle. I’ve torn down returned cells where a 3-micron calendering error produced a visible “tiger-stripe” density pattern — exactly the kind of defect that no end-of-line capacity test catches if the affected region is small. In-line porosity mapping is the only reliable guard.
X-Ray and Ultrasound for Hidden Defects
Some failures live inside the cell where the eye can’t go. We run two complementary non-destructive techniques. Micro-CT at the pilot stage resolves voids, wrinkles, and particle agglomerates down to roughly 5 microns, giving us the statistical baseline for a new electrode formula. On the production line we prefer inline ultrasonic C-scan, which flies a focused transducer across the web and flags delamination, debonding, and trapped gas with sub-millisecond response.
The reason this matters for a drone battery is mechanical. A quadcopter’s pack sees violent vibration and repeated g-loads; an internal delamination that survives a bench test can propagate in the air. A battery solution that ignores internal bonding is a liability, not a product. Ultrasound lets us reject a defective lane before it is ever wound.
Electrochemical In-Line Metrology: EIS and DCR
Geometry is only half the story. The interface between the composite cathode and the quasi-solid electrolyte is where semi-solid chemistry lives or dies, so we measure it electrically before formation is complete. Electrochemical impedance spectroscopy (EIS) at a partial state of charge reveals the interfacial semicircle — a rising resistance trend across a lot tells us the electrolyte wetting or the solid-electrolyte interphase is off, days before it would show up as capacity fade.
We pair EIS with direct-current resistance (DCR) mapping at multiple pulse currents. A cell whose DCR drifts more than 8% from its sibling in the same lot is pulled for teardown. This is how we defend the cycle-life numbers we publish; without in-line EIS, those numbers are guesses dressed up as data.
Capacity Grading, OCV and the UN38.3 Safety Gate
Formation and grading are where a semi-solid state battery proves it can ship. After the first charge, every cell sits on open-circuit voltage (OCV) for a stabilization window; we reject any unit whose OCV settles outside a 10-millivolt band relative to its graded capacity, because that spread signals a hidden internal leakage path.
Then comes the safety gate. Every production lot is sampled against UN38.3 test T.1 through T.8 — altitude simulation, thermal test, vibration, mechanical shock, external short circuit, impact, overcharge, and forced discharge. Our cells are also validated to IEC 62133-2 for portable safety, and for air transport we confirm compliance with FAA and EASA lithium-battery provisions so our custom battery solution customers can move product globally without re-testing. Passing these is not a marketing claim; it is the condition for the cell leaving the building.
Building a Traceable Metrology Loop With SPC
Individual sensors are useless if their data dies in a spreadsheet. We bind every measurement — coating thickness, porosity, ultrasonic map, EIS spectrum, OCV — to a unique cell or lane identity in the manufacturing execution system. Statistical process control (SPC) runs Cp and Cpk on each critical characteristic every shift; when Cpk drops below 1.33 we don’t argue, we stop the line and root-cause.
This genealogy is also our best sales tool. When an automotive or aerospace program audits us, we hand over the full measurement history of the exact cells in their prototype pack. That level of traceability is what separates a serious lithium battery manufacturer from a parts reseller, and it’s the foundation of any credible battery solution we deliver.
Metrology Economics: Why In-Line Pays for Itself
Teams sometimes ask whether all this sensing is worth the capital. The answer from our yield data is unambiguous. A semi-solid state battery line that inspects only at end-of-line throws away finished cells — electrolyte, formation energy, and labor already spent. Moving inspection upstream turns a scrapped finished cell into a rejected electrode lane that costs a fraction of a cent per square meter. On one automotive program we cut escaped-field failures by roughly 60% in two quarters simply by adding ultrasonic C-scan and EIS trending, and the payback on the sensors was under five months.
There is also a softer benefit: speed of learning. Because every lot now carries a full measurement genealogy, our process engineers can correlate a coating drift on Tuesday with a capacity outlier three weeks later. That feedback loop is what lets a battery solution actually improve instead of merely repeating. For any program betting on semi-solid chemistry at volume, in-line metrology is not optional equipment — it is the difference between a demo and a dependable supply chain.
Frequently Asked Questions
What is in-line metrology in battery manufacturing?
In-line metrology means measuring critical quality characteristics continuously on the production line rather than inspecting finished cells in a lab. For a semi-solid state battery it typically includes laser and X-ray coating gauges, porosity sensors at the calender, ultrasonic defect scanning, and electrochemical impedance spectroscopy during formation — all feeding a closed control loop in real time.
How accurate must coating mass loading be for a semi-solid state battery?
We hold areal mass loading to ±1.5% across the web and ±2% along the roll. Because the composite cathode has almost no liquid electrolyte to mask variation, tighter tolerance is what protects both energy density and interfacial reliability in the final lithium battery pack.
Which standards govern semi-solid state battery quality control?
Production lots are qualified against UN38.3 (T.1–T.8) for transport safety and IEC 62133-2 for portable-cell safety, with air-shipping alignment to FAA and EASA rules. Internal process control follows SPC discipline with Cpk monitoring on each critical characteristic.
Can semi-solid state batteries pass UN38.3 and air shipping under FAA and EASA?
Yes. With proper formation, OCV stabilization, and a verified safety gate, semi-solid cells meet the same UN38.3 test family required for lithium-ion, and we certify the lot for FAA and EASA air transport so customers can ship globally without duplicate testing.
How do you catch internal defects that visual QA misses?
Visual inspection only sees the surface. We rely on inline ultrasonic C-scan for delamination and voids, micro-CT at the pilot stage for sub-micron structure, and EIS-based interfacial resistance trending to flag cells whose internal bond or wetting is drifting before it becomes a field failure.