Semi-Solid State Battery Testing for EV Packs: My Full
I have spent the last eleven years building and validating lithium battery packs, and I can tell you that nothing exposed the gaps in my old test plan faster than semi-solid state cells. When my team at Horizon Power took our first hybrid-electrolyte prismatic cells into the lab and ran them through the same protocol we used for conventional NMC pouches, half the data came back looking wrong. Capacity was fine. Cycle life was fine. But DC internal resistance drifted between test stations, low-temperature pulse power looked inconsistent from one fixture to the next, and two cells that were electrically identical on paper reported a 14% spread in 10-second discharge resistance. Nothing was defective — our test method was.
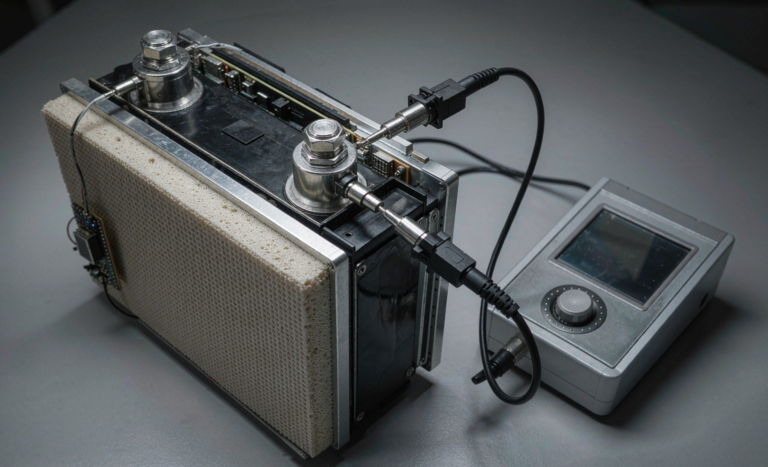
That experience is why I treat semi-solid state battery testing for EV packs as a discipline of its own rather than a copy-paste of legacy validation. The chemistry sits between liquid and solid: a gel electrolyte, thicker electrode coatings, and mechanical behaviour that couples directly into electrical performance. If your fixture does not control stack pressure, your data is noise. Below is the protocol my team now uses, from incoming cell screening to pack-level sign-off, with the standards and instrumentation settings we run on the floor.
Why Semi-Solid State Cells Break a Conventional Test Plan
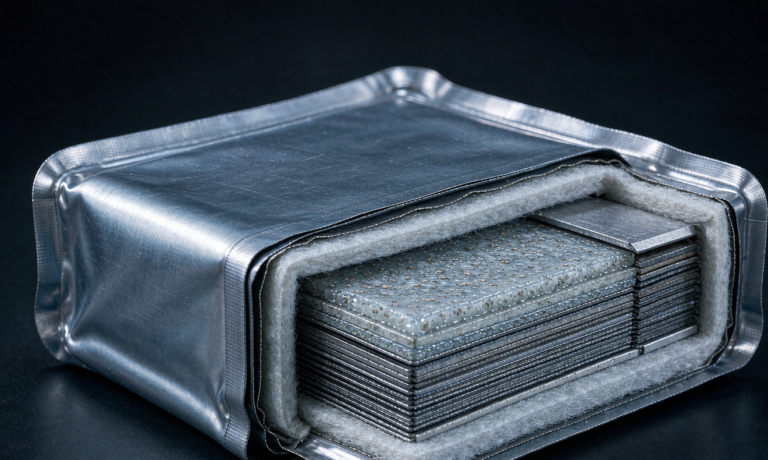
A conventional lithium battery cell has a fully wetted separator and a low-viscosity electrolyte that redistributes freely. Ionic transport is largely insensitive to modest external compression. A semi-solid state battery is different in three ways that matter to a test engineer.
- Pressure-dependent impedance. The gel electrolyte and thick electrodes rely on intimate interfacial contact. On our pouch samples, moving stack pressure from 0.1 MPa to 0.4 MPa reduced 10-second DCIR at 25 °C by 9 to 13%. Uncontrolled pressure is therefore the single largest source of test-to-test variance.
- Longer wetting and formation. Thicker electrodes need more soak time. We hold cells 24 hours minimum after electrolyte fill and before formation, versus 8 to 12 hours for our standard liquid designs.
- Steeper low-temperature resistance rise. Between 25 °C and −10 °C, our semi-solid samples showed roughly a 2.6× DCIR increase, compared with about 2.0× for a comparable liquid NMC cell. Any test plan that qualifies cold-weather performance by extrapolation will overstate capability.
The conclusion is simple: before generating a single datapoint you intend to defend to a customer, fix the mechanical and thermal boundary conditions, and only then discuss electrical results.
Step 1: Incoming Cell Screening and Impedance Fingerprints
Every lot arriving at our validation lab gets a 100% screening pass before any cell enters a performance or abuse test. Semi-solid state manufacturing tolerances are still tighter than the process capability of most lines, so screening protects your later statistics.
Our screening record for each cell contains:
- Open-circuit voltage after 48 hours rest, with a lot acceptance band of ±10 mV around the lot median.
- AC impedance at 1 kHz, ±8% around the lot median. We reject outliers rather than “using them for abuse tests” — a mechanically abnormal cell produces a misleading abuse result.
- Electrochemical impedance spectroscopy from 10 mHz to 10 kHz at 50% state of charge, 25 °C, under 0.3 MPa fixture pressure. The charge-transfer semicircle diameter is our fingerprint; it correlates with later capacity fade better than 1 kHz impedance alone.
- Dimensional check on thickness at five points, because a 3% thickness outlier at incoming inspection usually becomes a 3% capacity outlier at cycle 300.
- CT or X-ray spot check on 5% of the lot for electrode alignment.
All of it goes into a per-cell serial record. When a pack fails at month nine, walking backwards from a serial number to its incoming EIS fingerprint is worth more than any post-mortem teardown.
Step 2: The Electrical Performance Matrix
Once screened, cells run a performance matrix mirroring the intent of ISO 12405-4 for electrically propelled road vehicles. It is a temperature axis crossed with a rate axis, every point repeated on at least five cells so we report standard deviation rather than a hero number.
Temperatures: −20, −10, 0, 25, 45, and 55 °C, soaked to within 1 °C for four hours before each block. Rates: C/3, 1C, 2C, and 3C discharge; C/3 and 1C charge at 25 °C and above, C/5 charge below 0 °C to keep plating risk controlled.
Within that grid we capture four things:
- Capacity and energy in Ah and Wh, referenced to the C/3 25 °C baseline.
- 10-second DCIR at 20, 50, and 80% state of charge, using a hybrid pulse power characterisation profile.
- Peak pulse power held to the voltage limits declared in the cell specification, not to an arbitrary cutoff. On our 60 Ah semi-solid samples, 10-second discharge power at 50% SOC and 25 °C measured 4.1 W/Ah, falling to 1.6 W/Ah at −10 °C.
- Coulombic and energy efficiency per cycle, logged at 1 Hz minimum. Below 0 °C we sample at 10 Hz during pulses because the voltage response is fast enough to alias at slower rates.
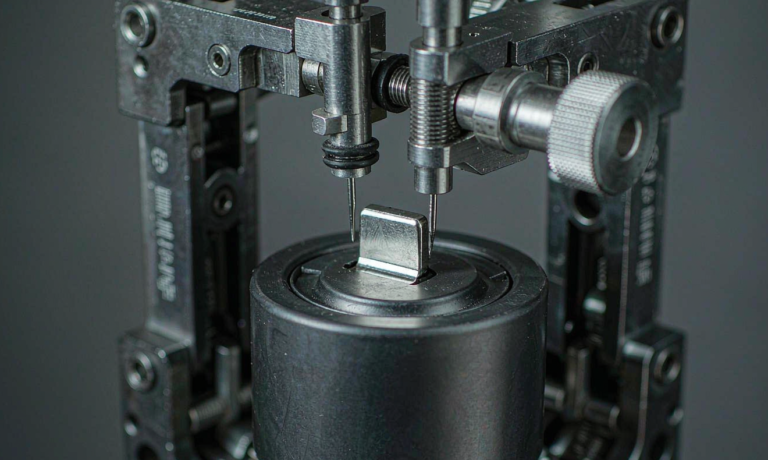
One instrumentation note that has saved us repeatedly: use four-wire sensing with sense leads landed on the tab weld, not the cycler cable lug. On a 3C pulse through a 60 Ah cell, a 1.5 mΩ cable-side error appears as roughly 270 mV of apparent sag — enough to make a good cell look unusable.
Step 3: Thermal and Environmental Validation
Thermal behaviour is where this chemistry earns its reputation, and where sloppy instrumentation destroys credibility. We bond five type-K thermocouples per cell minimum: both tabs, the centre of the largest face, one edge, and one on the fixture plate as reference. Adhesive matters — a poorly bonded thermocouple reads air, not cell, and underreports peak surface temperature by 4 to 8 °C.
The environmental block covers:
- Thermal cycling per the intent of UN 38.3 test T.2: six-hour holds at 72 ± 2 °C and −40 ± 2 °C, ten cycles, then capacity verification.
- Temperature and humidity per ISO 16750-4 damp heat cyclic, because EV packs live in road environments, not chambers.
- Vibration per UN 38.3 T.3: sinusoidal sweep 7 Hz to 200 Hz and back, three hours per axis on all three orthogonal axes, with acceleration ramping to 8 g. For pack-level work we add random vibration profiles representing the vehicle mounting location.
- Mechanical shock per UN 38.3 T.4: 50 g half-sine for 11 ms on large cells, 150 g for 6 ms on small cells, three shocks per direction.
- Ingress protection to IEC 60529, typically IP67 for underbody EV enclosures, verified after the vibration block rather than on a virgin sample.
We re-run capacity and DCIR after every environmental block. “No leakage, no venting, no fire” is necessary but not sufficient — a cell that survives shock with a 6% DCIR increase has told you something important about internal mechanical margin.
Step 4: Abuse and Safety Testing
Abuse testing is where I insist on a written, signed test plan before the first sample is destroyed — you get one shot per cell, and the instrumentation setup decides whether you learn anything.
Our baseline safety set for a semi-solid state battery destined for EV service:
- UN 38.3 T.1 altitude simulation: 11.6 kPa or less for six hours at 20 ± 5 °C. Required for shipment regardless of application, and the same certificate covers air freight for our aviation and drone battery product lines under FAA and EASA dangerous goods rules.
- T.5 external short circuit: external resistance of 0.1 Ω or less at 57 ± 4 °C, held one hour after the cell case returns to within 10 °C of ambient.
- T.6 impact or crush and T.7 overcharge at twice the manufacturer’s recommended charge current, plus T.8 forced discharge.
- IEC 62133-2 construction and safety requirements where portable secondary cells are in scope, and IEC 62619 for industrial applications including stationary and traction use.
- Nail penetration and thermal propagation in line with GB 38031, where the requirement is that a single-cell thermal runaway event must not produce fire or explosion in the pack, with occupant warning provided ahead of any hazardous condition.
- SAE J2464 style abuse sequencing for overtemperature and mechanical integrity when the customer’s programme calls for it, and UL 2580 for North American EV pack certification paths.
Two observations from our own runs. Semi-solid cells vented later and with less aerosol volume than the liquid-electrolyte cells tested alongside them, but vented gas temperature at the orifice was comparable — enclosure design cannot be relaxed on chemistry alone. And always instrument neighbouring cells in a propagation test with their own thermocouples and voltage taps: the number customers care about is the delay between cell one and cell two, and you cannot recover that from video.
Step 5: Pack-Level Integration and BMS Validation
Cell data qualifies a chemistry. Pack data qualifies a product. When we move to module and pack level, the test scope shifts from electrochemistry to systems engineering, and this is where most custom battery solution programmes lose schedule.
Our pack-level checklist:
- Isolation resistance measured at 500 VDC, verified against the ISO 6469-3 requirement of at least 100 Ω/V for DC circuits, before and after every environmental block.
- Dielectric withstand between the high-voltage bus and the enclosure, per the pack’s declared working voltage class.
- Contactor and pre-charge sequencing verified with a current probe on the pre-charge resistor. We confirm inrush stays inside the resistor’s pulse energy rating and that the main contactor closes only after the bus is within 5% of pack voltage.
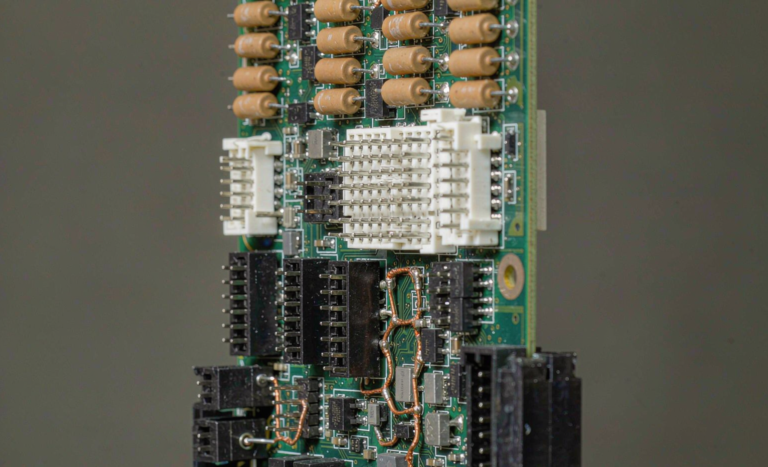
- Cell voltage measurement accuracy across the full temperature range, verified against a calibrated reference with a target of ±5 mV. Semi-solid state cells have a flatter mid-SOC voltage curve than some liquid chemistries, so state-of-charge estimation error scales hard with measurement error.
- Balancing throughput measured, not assumed. We log the time to close a deliberately induced 120 mV spread and compare it against the field duty cycle.
- Communication robustness: heartbeat timeout behaviour, CAN bus loading under fault storms, and safe-state transition within the declared window when the vehicle controller stops responding.
- Thermal management verification with the production coolant plate at worst-case flow and inlet temperature, confirming the cell-to-cell gradient stays within the 5 °C band we commit to in specifications.
Step 6: Lifecycle Aging and What to Log
Aging tests are expensive and slow, so the discipline is in the logging, not the cycling. We run calendar aging at 25, 45, and 60 °C at 30, 60, and 100% SOC, plus cycle aging at 25 and 45 °C using a standard 1C/1C profile and a customer-representative dynamic profile.
What we log on every aging cell: capacity checkpoint every 50 cycles at C/3 and 25 °C; DCIR at the same checkpoints; thickness under fixed fixture pressure; fixture pressure itself, because thick-electrode cells grow and pressure creeps upward over hundreds of cycles; and surface temperature continuously. At 80% of initial capacity we do not stop — we continue to 70% to characterise the knee, because that shape determines whether a warranty model is defensible.
Across our first three semi-solid state sample builds, cycle life to 80% capacity at 25 °C and 1C/1C came in between 1,850 and 2,400 cycles, with the lower numbers correlated almost entirely to fixtures where pressure was allowed to drift below 0.15 MPa. That correlation is the single most useful result my team has produced in this programme.
The Sign-Off Package
A test campaign is not finished when the data exists. It is finished when someone can audit it. Our release package contains: the screening record with per-cell serials and EIS fingerprints; the performance matrix with standard deviations and fixture pressure; environmental block reports with pre- and post-block electrical verification; the UN 38.3 test summary; safety reports against the applicable IEC and regional standards; pack-level isolation, dielectric, and BMS verification records; aging data with the checkpoint methodology stated; an instrument calibration register with dates; and a deviation log.
That last item is what engineers skip and auditors always request. Write it as you go.
Frequently Asked Questions
Can I use my existing lithium-ion test plan for semi-solid state cells?
Partly. The standards framework carries over — UN 38.3, IEC 62133, IEC 62619, ISO 12405-4 all still apply. What must change is fixturing and boundary-condition control. Add explicit stack pressure specification and monitoring, extend soak and rest times, and add sub-zero test points instead of extrapolating from room temperature. Reusing a plan without those changes is the most common reason a semi-solid state programme produces data nobody trusts.
What stack pressure should I specify for testing?
Follow the cell supplier’s specification first. In the absence of one, our practice for semi-solid pouch formats is 0.2 to 0.4 MPa with continuous load-cell monitoring, and we record pressure in every report. For prismatic hard-case formats the fixture requirement is lower, but you still constrain expansion rather than leaving the cell free-standing. The critical rule is that pressure is a reported test parameter, not a lab detail.
How many cells do I need per test point?
Five minimum for performance characterisation, so you can report a mean and standard deviation. For abuse testing, three per condition is the common regulatory minimum, but if you are characterising the failure mode rather than simply passing, plan for five. For aging, three per temperature and SOC combination plus spares, because thermal chambers fail.
Does semi-solid state chemistry pass air transport requirements?
Yes, provided the cell and pack pass UN 38.3 testing and are packaged and documented per applicable dangerous goods rules. The transport framework has no separate barrier for semi-solid electrolytes. We hold current UN 38.3 test summaries across our product families, including the aviation and drone battery lines that ship under FAA and EASA state-of-charge and packaging provisions.
How long does a full validation campaign take?
For a cell already in stable production, our compressed schedule is about 14 to 18 weeks: two weeks screening, four weeks performance matrix, four weeks environmental and abuse, and the balance for pack-level integration. Aging runs in parallel and continues well past release — expect six to nine months before you have defensible cycle-life data with a characterised capacity knee. Anyone promising a full campaign in six weeks is either reusing existing data or skipping the parts that matter.
What is the most common testing mistake you see?
Measuring at the cycler instead of at the cell. Four-wire sensing landed on the tab, calibrated shunts, and a documented lead resistance budget separate real engineering data from marketing numbers. The second most common mistake is treating a passed abuse test as a finished result rather than reading the post-test electrical delta, which is usually where the interesting information hides.
Working With Our Engineering Team
Every custom battery solution we deliver ships with the test evidence behind it, because in this industry the data is the product as much as the hardware. If you are building an EV, robotics, or home energy storage platform and want a validation plan reviewed before you commit chamber time, my team is happy to look at it.