Drone Battery Testing for Mapping UAVs
When a survey client pays for a 250-hectare photogrammetric map at 3 cm ground sampling distance, they are not buying flight time. They are buying clean, georeferenced data. A pack that simply has enough watt-hours is necessary but not sufficient — the battery has to survive takeoff spikes, hold its voltage through shutter moments, keep the RTK fix alive, and behave identically across a fleet of twenty aircraft. As Karl Huang, Senior lithium battery Engineer at Horizon Power, I treat a mapping-UAV drone battery as a flight-critical component, not a commodity cell strapped to a frame. That means it earns its place in the airframe only after a structured qualification program. The testing regime below is the one we run before any new custom drone battery platform enters paid survey service.
Why Mapping UAVs Need a Different Test Regime
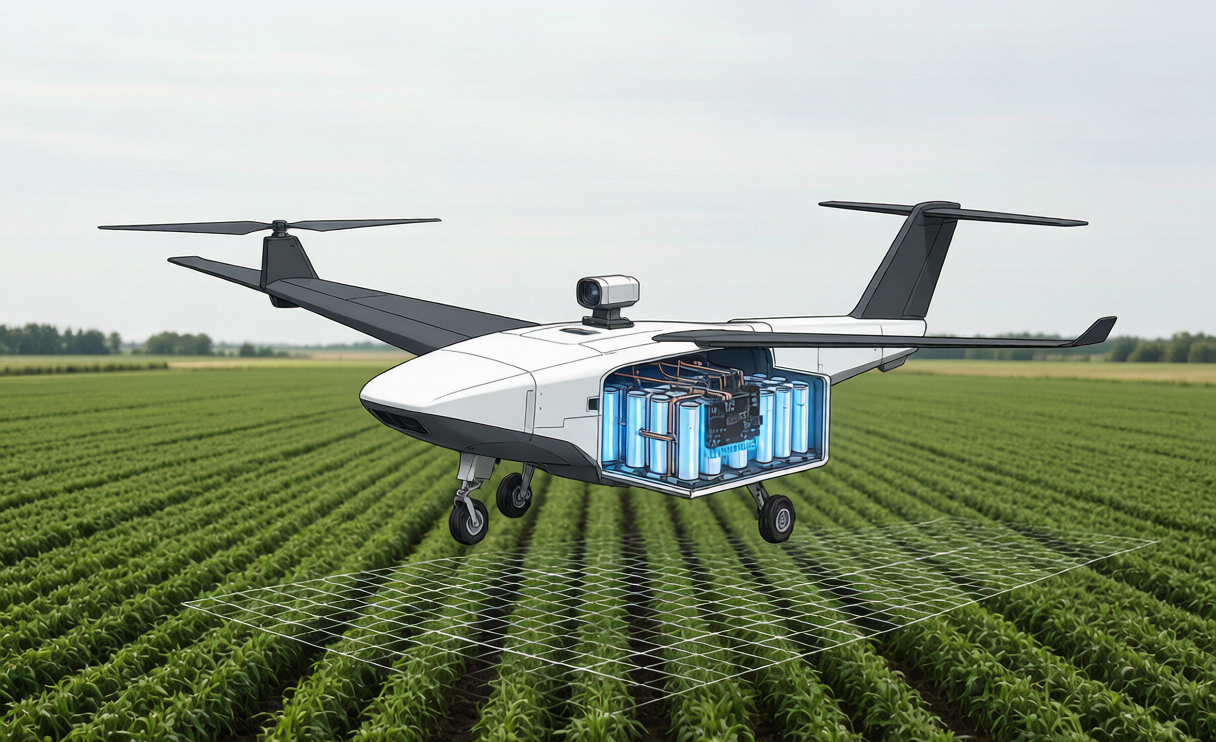
A mapping sortie is a slow, steady, energy-limited duty cycle: climb, transition, long loiter at cruise power, repeated camera triggers, and a measured return-to-landing. Peak C-rate rarely exceeds 1.5–2.5C, so the pack is never asked to deliver racing-drone bursts. What it is asked to do is hold a stable, low-noise bus for 40–70 minutes while a sensitive payload samples the world. That shifts the test priority away from raw pulse power and toward voltage stability, thermal uniformity, RTK-data integrity, and lot-to-lot consistency. A drone lithium battery that passes a discharge curve but fails the sag bench test at the shutter moment will quietly corrupt a block of imagery — the worst kind of failure because it looks like a pilot error, not a pack fault.
This is also why I separate the testing axis from the performance, reliability, and cost work we have already published for mapping platforms. Here the question is narrower and earlier in the lifecycle: how do we prove the battery is fit before a single commercial flight?
Incoming Inspection — Prove the Cells Before You Build the Pack
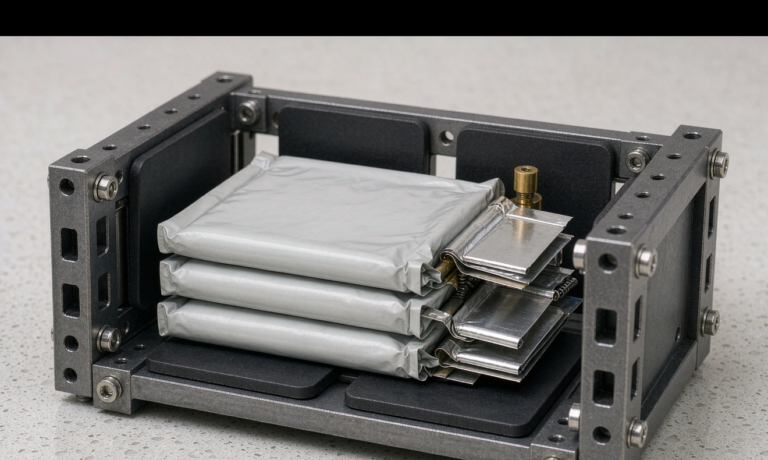
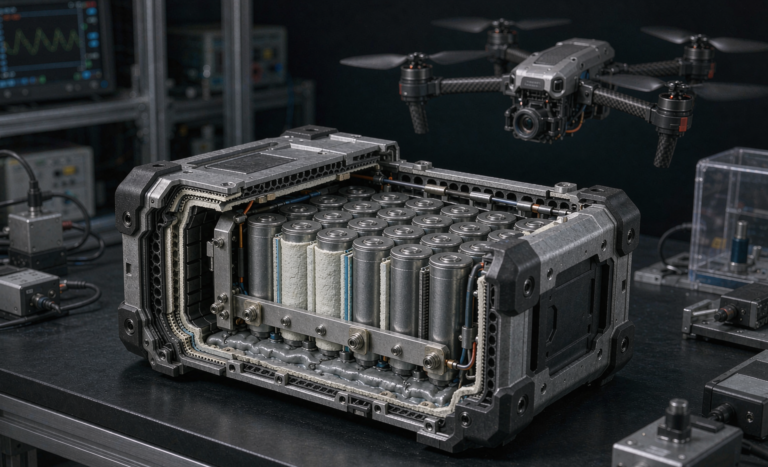
Qualification starts at the cell level. Every incoming lot of 21700 or pouch cells is sampled on an AC internal-resistance (ACIR) bench at 1 kHz, and we reject the lot if cell-to-cell resistance delta exceeds 30 mV equivalent or if capacity spread exceeds 2%. Thickness is measured at the storage voltage of 3.80–3.85 V/cell, because swelling anomalies only show up near the top of charge. For a mapping lithium battery platform the cost of one weak cell is not just lost capacity — it is a localized hot spot that, across a 20-aircraft fleet, becomes a reliability tax.
We also record a baseline QR/serial identity for every pack, capturing outgoing IR, capacity, and thickness. That baseline is the reference against which every future field measurement is judged, and it is what later lets a technician decide a warranty claim in minutes rather than days. This discipline is non-negotiable for any custom battery solution destined for survey fleets where traceability is part of the contract.
Pack-Level Performance Validation — The Sag Bench Test
The single most important bench test for a mapping pack is the DCIR sag test. We pulse the assembled pack at 3C for 10 seconds and measure the voltage drop against the open-circuit value. Our acceptance limit is pack DCIR below 10 mΩ measured at 1 kHz plus the 3C/10 s pulse, with total busbar-plus-interconnect sag kept under 8% of nominal. The reason is mechanical: a mapping drone hovering at 0.8–1.4 kW with a 175 A transient during a maneuver can lose 1.2–1.8 V if the pack resistance is wrong, and that sag propagates through the ESC into motor RPM and then into gimbal micro-jitter at the exact instant the shutter fires.
We size the interconnect budget so that connector and harness resistance stays below 15% of total pack resistance — practically 1.5–1.8 mΩ achieved with XT150/AS150 connectors and 8 AWG gold-over-nickel cable rated for 500–1000 mating cycles. The 6S-to-12S voltage-platform decision is verified here too: raising the bus from 6S to 12S halves the current and quarters the I²R loss (144 W at 120 A on 6S versus 36 W at 60 A on 12S), which is exactly why our mapping packs run a 12S architecture.
Environmental Qualification — From -20°C to 55°C and 2,500 m
Survey work happens at dawn in February and at noon in the desert, and the test chamber has to reproduce both. We run a thermal-cycle profile from -20°C to +55°C with dwell at each extreme, measuring capacity retention and IR growth. The characteristic lithium fade curve we design against is 100% at 25°C, 85% at 0°C, 70% at -10°C, and 55–60% at -20°C. For cold-climate dawn windows we validate a 5–15 W pad heater that brings core temperature into the 10–25°C window before launch, recovering roughly a third of the cold capacity loss without oversizing the pack.
Altitude matters for mountain or plateau surveys: at 2,500 m the air is thinner and rotor power rises 8–12%, so we de-rate the endurance model and confirm the pack still meets the 30% BVLOS/FAA Part 107 / EASA SORA reserve at altitude. Vibration qualification follows DO-160 and MIL-STD-810 across the 5–2000 Hz band, with the mounted resonance deliberately cleared more than 30% above the rotor and blade-pass frequencies so the pack never walks itself loose in flight.
Mission-Profile Simulation — Replaying the Photogrammetry Duty Cycle
A discharge curve at a flat 1C tells you almost nothing about a survey mission. We instead replay the actual photogrammetry duty cycle on a cycler: a short high-current climb, a long steady cruise at 0.8–1.4 kW, periodic payload spikes for RGB, multispectral, or LiDAR payloads (5–40 W), and RTK/compute draw of 5–12 W and 10–25 W respectively, plus a +10–25% gust overhead. We then overlay the GSD arithmetic: ground sampling distance equals pixel pitch times altitude divided by focal length, so a 20 MP sensor with a 24 mm lens yields about 2.5 cm per pixel at 100 m and 1.25 cm per pixel at 50 m — and halving the altitude doubles line-kilometers and quadruples image count, which the battery must sustain.
Using 65–70% side overlap and 70–80% forward overlap on a representative 250-hectare block, we confirm the pack delivers the modeled energy with margin. A passing pack must finish the block on a single charge with the regulatory reserve intact; if it needs a mid-block swap, the airframe integration is wrong, not the cells. This simulation is where we validate that the chosen chemistry — typically NMC/NCA at 200–250 Wh/kg and 500–1000 cycles for energy-limited duty, with LFP at 120–160 Wh/kg as a ground buffer and semi-solid at 250–300 Wh/kg qualifying where mass pays — actually meets the contract.
Data-Integrity Verification — Protecting the RTK Fix and the Shutter
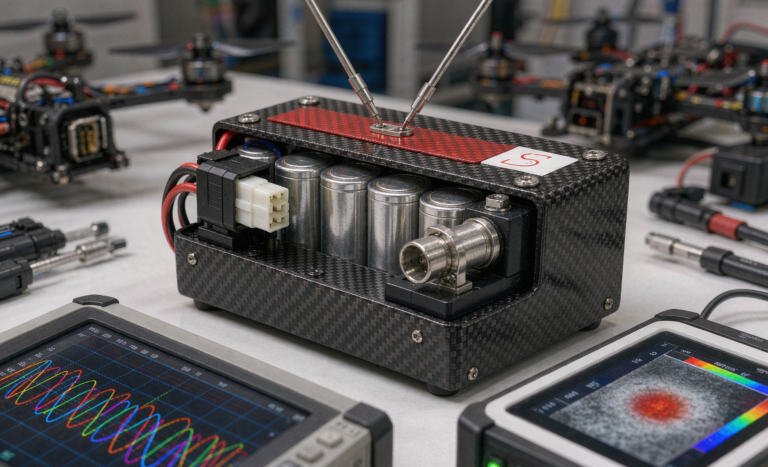
This is the test that separates a mapping pack from a generic drone battery. We deliberately inject motor transients onto the bus and measure the response of the isolated, regulated payload rail. Acceptance is a holdup of 20–40 ms with cell balance within ±2–5 mV and a delta alarm at 20–30 mV. If the rail sags when the rotors surge, the RTK fix can drop and the imagery loses its geotags — a failure no amount of post-processing fully recovers. We correlate bus voltage against a live RTK lock indicator during the replay so the acceptance report shows, numerically, that the fix stayed solid through every maneuver.
We also log the BMS telemetry stream (1–10 Hz steady, 100 Hz on events) to confirm cell-delta, thermal gradient, and cycle counters report cleanly. A healthy pack shows a 3–5°C gradient across cells; an 8–15°C hot spot during the 2–3C replay is an automatic fail and points to a bonding or thermal-path defect.
Transport and Fleet Acceptance Qualification
Before the pack ever leaves the factory floor it must clear transport certification: UN38.3 T.1–T.8 (altitude simulation, thermal test, vibration, shock, external short, impact, overcharge, forced discharge), IEC 62133-2:2017 for secondary lithium cells, and IATA rules requiring shipment at or below 30% state of charge. For aircraft carry-on and most commercial packs we keep each unit inside the FAA Part 107 / EASA SORA ceiling of 100–160 Wh. These are not optional paperwork steps; they are part of the same qualification file that proves the product is safe to ship and safe to fly.
Fleet acceptance uses lot sampling with strict binning: ±2% capacity and ±5% DCIR within an age cohort, so that twenty aircraft behave like one. Packs that fall outside the cohort are retired or rebuilt rather than mixed in, because a single outlier in a synchronized sortie is what produces the “one drone landed early” reports that erode client confidence.
Field QA Cadence That Keeps the Lot Honest
Qualification does not end at shipment. We specify a field cadence: daily IR spot-checks against the QR baseline, first-in-first-out rotation, storage at 3.80–3.85 V/cell, charging at a 40°C gate with no ice or water cooling, and a three-zone staging layout so a depleted pack never gets confused with a ready one. Retirement thresholds are fixed and documented: 80% state-of-health, twice baseline internal resistance, more than 50 mV cell delta, or greater than 5% puffing. A well-run qualification and QA loop is what lets a custom battery solution keep delivering usable survey blocks flight after flight, and it is the backbone of every Horizon Power mapping program I sign off on.
Frequently Asked Questions
What is the most important test for a mapping-UAV drone battery?
The DCIR sag test at 3C/10 s. It proves the pack holds its voltage through motor transients, which directly protects image sharpness and RTK lock during the shutter moment — the failure modes that matter most for survey data.
Why does a mapping battery need an isolated payload rail?
The isolated, regulated rail with 20–40 ms holdup keeps the RTK receiver, camera, and compute isolated from motor bus transients. Without it, a rotor surge can drop the GNSS fix and strip geotags from the imagery, which no software fix fully recovers.
How cold can a mapping drone battery operate?
We design and test down to -20°C, where lithium capacity falls to roughly 55–60% of its 25°C value. A 5–15 W pad heater brings the core into a 10–25°C window before launch, recovering about a third of that loss without oversizing the pack.
Which chemistry do you qualify for energy-limited survey duty?
Typically NMC/NCA at 200–250 Wh/kg and 500–1000 cycles for the airframe, LFP at 120–160 Wh/kg for ground buffers and charging carts, and semi-solid at 250–300 Wh/kg where mass or range justifies the premium. High-power LiPo is rejected for survey work because its 20–30% energy penalty shrinks coverage per charge.
How do you keep a fleet of mapping batteries consistent?
By binning each age cohort to ±2% capacity and ±5% DCIR, tracking every pack by QR/serial baseline, and retiring outliers at 80% SOH, twice baseline IR, 50 mV cell delta, or 5% puffing. Mixed-age packs in a synchronized sortie are the root cause of uneven endurance.